OpenStreetMap

SomeoneElse's Diary

Recent diary entries

Bus Stops

Posted by SomeoneElse on 18 March 2024 in English.

There’s lots of data stored in OSM about bus stops, but often maps and apps created with OSM data don’t make much use of it (with OsmAnd being the notable exception). For here’s a bus stop as shown by OSM Carto:

Bus stop in York in OSM Carto

You can see that it’s a bus stop, and you’d be able to see the name if you could zoom in a bit more. However, in OSM there’s actually lots more information. For the map styles that I look after (both web-based raster maps and for Garmin devices) I tried to add a bit more detail. Here’s the result:

Bus stop in York at map.atownsend.org.uk

The bus stop icon has several extra elements that can be varied. The main part is the bus - still present but disused stops get a black “x” instead. Most bus stops have a pole. and that is shown to the right. The “r” indicates that there’s some sort of real-time display at the stop and the “s” that there’s a button that people can press to hear an announcement saying when the next buses are due. A “t” is shown if there’s just a timetable. The stop name itself is composed of several components - the name field itself, and also if set ref and naptan:Indicator, often “opp” or “adj” in the UK.

A feature of bus stops in my local area is that most also have a QR code of the form http://deps.at/?32900012, which redirects to a website for that stop that shows the same information as on real-time displays. The parameter is the naptan:NaptanCode. Unfortunately this doesn’t work for all stops, so I’ve manually added the website locally only where it actually works. The website is shown on the stop when you zoom in.

Bus stop showing website

The full variety of symbols can be seen in the legend here. Zoom in to see larger icons.

Several tags are used to decide whether a bus stop pole is likely to be there or not, and I’ve used "physically_present=yes is used on disused bus stops to indicate that a pole exists but they’re not in use. Some in my local area are signed as not in use, but the majority are not - the only indication is uaully the lack of a timetable.

Newer buses locally do have displayed and spoken announcements of stop names on board, but sometimes the name on the stop, the name displayed on the bus and the name announced on the bus are all different - see for example here and here. I’ve used bus_display_name and bus_speech_output_name where these differ. I made those last two names up; I couldn’t see anything at taginfo and a mailing list post didn’t generate any other suggestions. If either of the other names isn’t contained within the main one, I’ve appended them to the end, like this:

Bus stop with multiple names

Of course, if someone can suggest a better tag for these names I’m all ears (but not alt_name or some semicolon=separated monstrosity as neither of those would explain which name is which).

Maps for Garmin are similar, except that relevant information is appended to the name directly. Also note that a number of Garmin devices such as older Garmin Nuvi satnavs (and presumably newer Garmin drive ones) support speech output directly.

Location: Leeman Road, Holgate, York, England, YO26 4YB, United Kingdom

Showing things at higher zoom levels

Posted by SomeoneElse on 6 February 2024 in English.

Signpost near Husthwaite

Although the raster maps at maps.atownsend.org.uk support zoom levels up to 24, until recently I’ve not made much use of that for showing extra data. However, there is a lot of room at these high zoom levels - as the picture above shows, enough for all the directions on this signpost here.

The name is shown as normal at lower zoom levels, then as you zoom in the directions are shown too, as you can see here.

Location: Acaster Mill, Husthwaite, North Yorkshire, England, YO61 4PG, United Kingdom

What's new on the maps at map.atownsend.org.uk

Posted by SomeoneElse on 28 December 2023 in English. Last updated on 6 February 2024.

Norfolk coast near Cley

Tidal and non-tidal wetland

A major rewrite here takes into account tags such as natural, reef, wetland, surface and tidal before deciding how to show wetland areas. See the picture above, which is here, and here in OSM.

The beach between high and low tide can be clearly seen here (in OSM, here). There are blue dots in the sand rather than black. A deliberate decision was taken to show more detail for areas above low tide. See e.g. here between Wales and the Wirral (see here in OSM).

Island and islet names

Skye

Island and islet names are shown based on their size. Try going here and then zooming out - small island names disappear first, with the larger ones such as Skye disappearing much later.

Width of rivers and streams

The Oxford Canal and the Cherwell in Cropredy

Many rivers and streams don’t have water areas mapped for them, which means that maps have to decide what to do at higher zoom levels. The Cherwell on the right on the picture above is an example of that. For rivers and canals, I’ve tried to match what “the actual width of a small river” might be. For an example, see here just up-river from the previous picture. At high zoom levels, the river’s width is about the same fraction of the bridge length. If you look at the imagery here you’ll see that the width is about right.

The same principle is applied to streams, drains and ditches, although of course they are narrower.

Cycle routes, National Byway etc.

South of the Humber Bridge

Long route “names” are a challenge in OpenStreetMap. I’ve used various methods to try and suppress these, but it’s not always successful. In the screenshot above you can see this part of the Viking Way which aparently is named “Viking Way (Barton-upon-Humber to Barnetby)”, and this cycle route called “NCN 1 Humber Bridge east alternative”. Thankfully, some examples can be special cased:

Castle Howard

Here the main National Byway and one of the loops have been detected and display using just “NB” and “NB (loop)”, which is essentially what appears on the signs - the signs do not say (in this example) “Malton Loop”.

I’ve also tried to distinguish national and regional routes:

WYCR in Wetherby

Here the National Cycle Network route 665 and the regional West Yorkshire Cycle Route can be seen - the regional route has an “r” appended to the name. Options for other distinguishing features are limited - colour is used to tell the difference between foot, horse and cycle routes already.

Lots more historical icons

The historic key is an absolute goldmine, if you sidestep the “unhelpful” keys (such as “yes”). These maps are created for Britain and Ireland, so I’ve concentrated on getting values used in Britain and Ireland shown. This has been a bit of a challenge - objects under this key include palaeontological sites like this, archaeological and historic sites from many periods, many different archaeological site types. Many are fortifications, of many different types. Many ancient sites cross over between uses (for just a taster of some of the issues, see here), so deciding how to show them can be a bit of a “choose your own adventure”.

Historic part of map legend

What I’ve ended up with can be seen here. There are about 50 currently - scroll to the right to see them all!

Archaeological features incorporate four vertical posts in the icon, along with (say) a ring for a ringfort and a hill for a hillfort. Ringforts can be tagged in at least four different ways and hillforts five (that I’ve found so far), so deciding what goes in what bucket is a challenge. Other features also try and use variations on a theme (on a “standard tower”, on a building, on a church, or on a stone).

Hopefully the result fits in well with the rest of the landscape:

Western part of Dingle / An Daingean peninsula

Location: Reask, Marhin ED, Kenmare Municipal District, County Kerry, Munster, V92 P681, Ireland

ChangesetMD

Posted by SomeoneElse on 6 August 2023 in English.

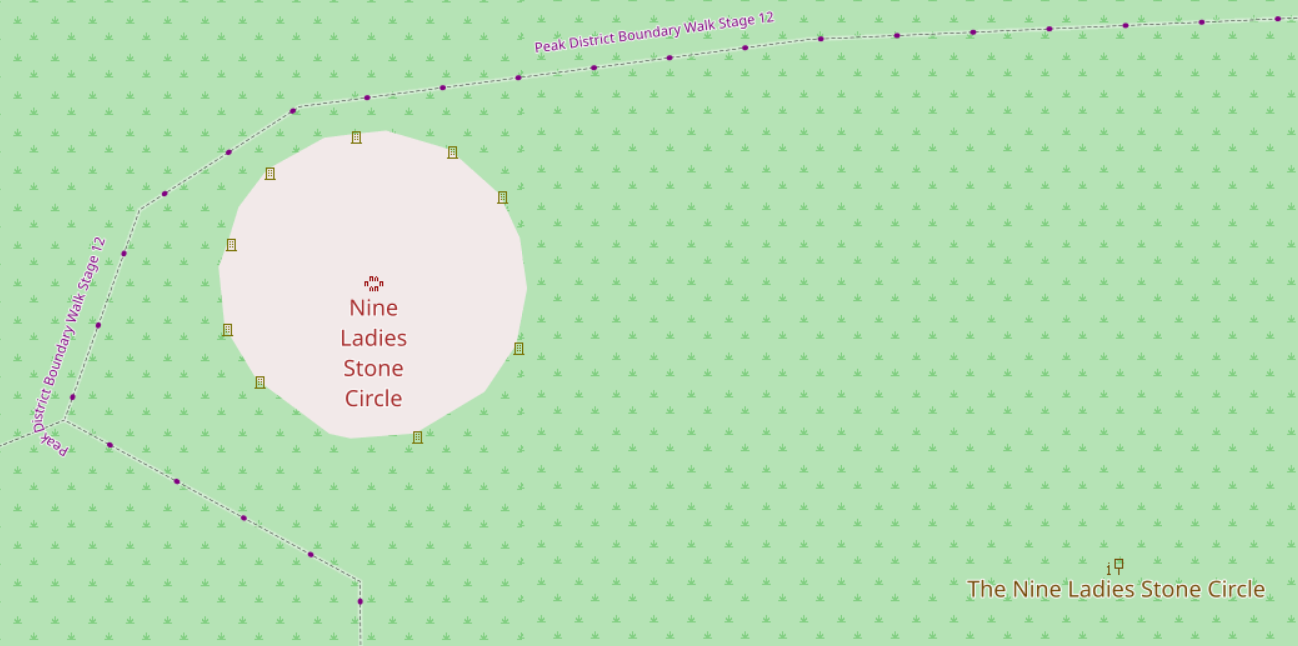
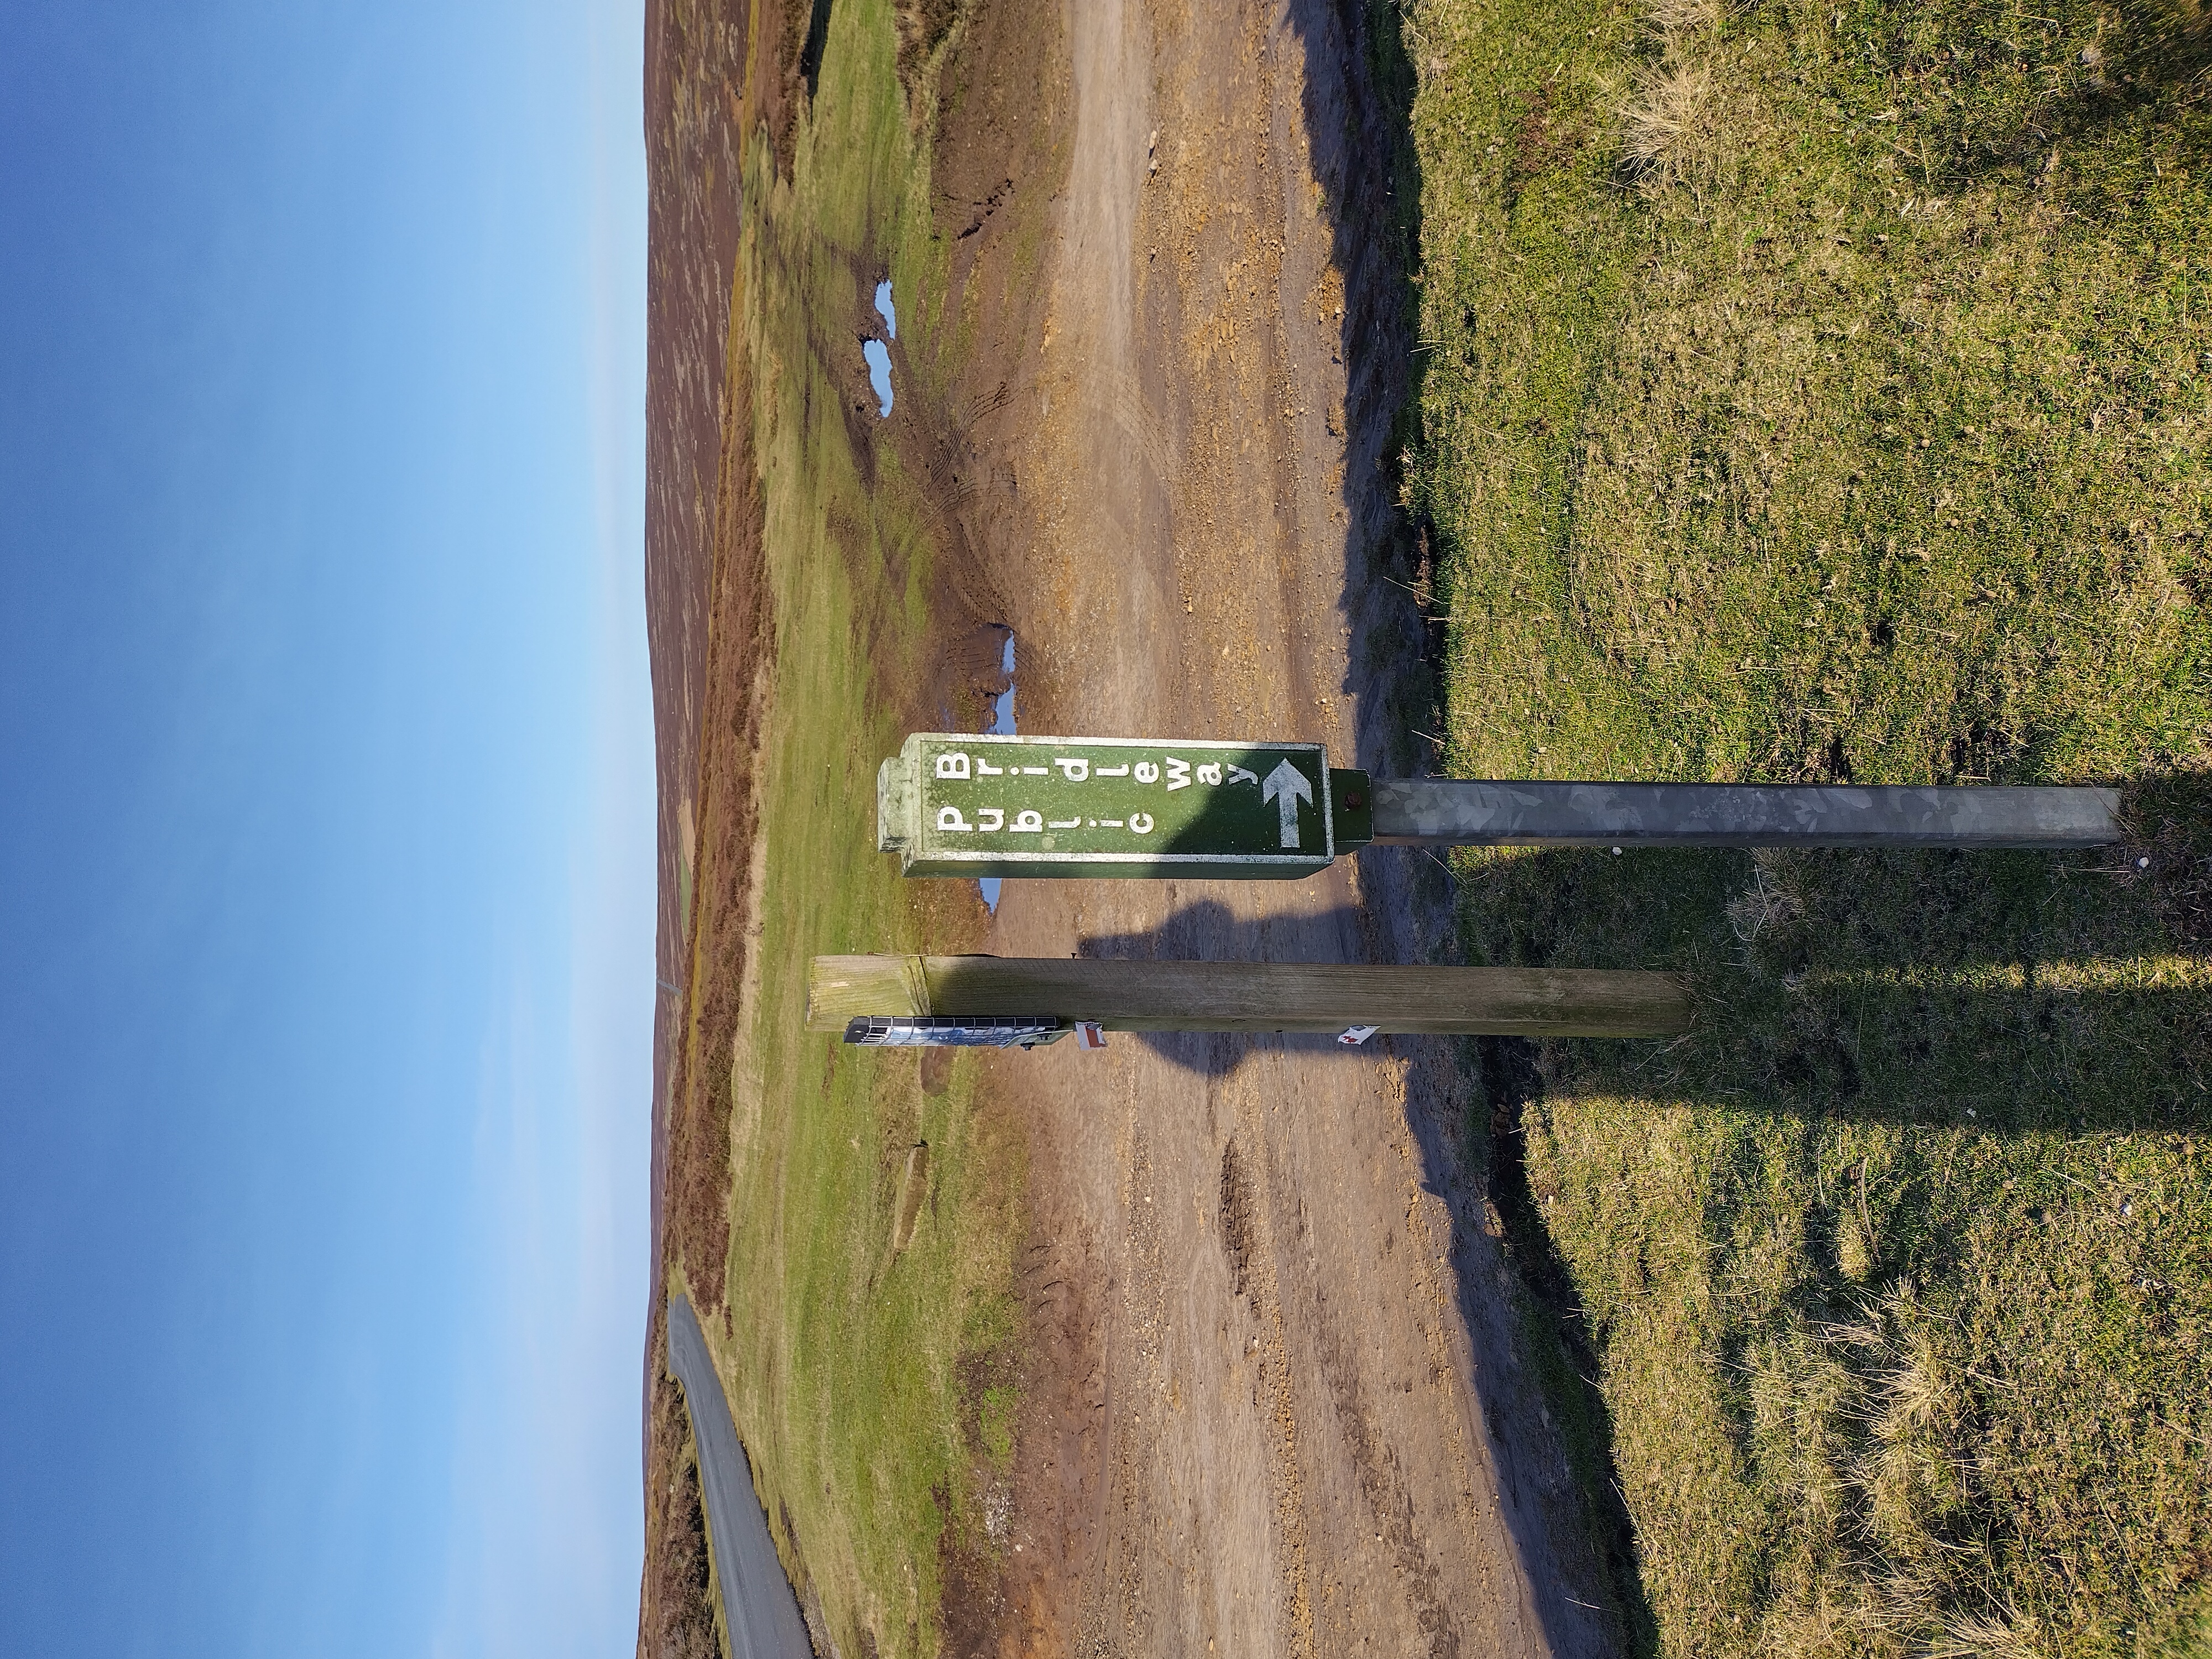
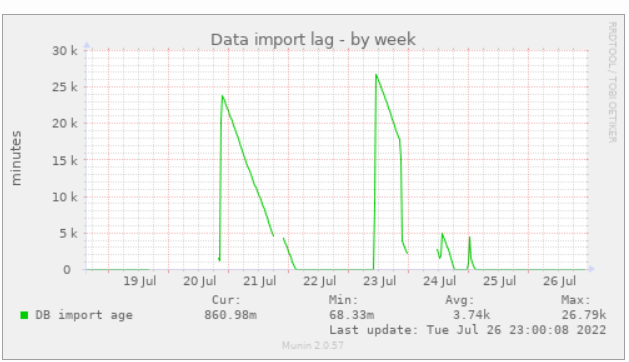
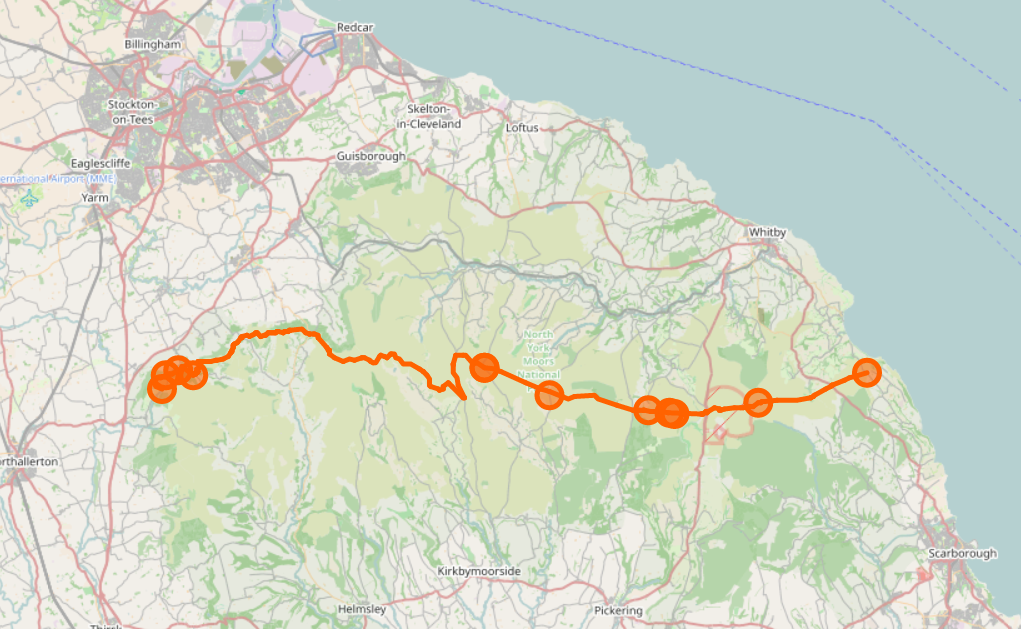
There’s lots of software around to work with OpenStreetMap data - querying it, creating maps from it, using it for navigation. One area that there has historically been less support is analysing OSM changeset data. As an example, here is one of mine.

However, many years ago Toby Murray wrote ChangesetMD. That can be used to maintain a database of changeset information (tags, discussions, etc.). Martijn van Exel updated that to a recent version of Python and I made a couple more changes to support very recent Python versions and made the replication more scriptable.

Downloading changeset data

Over on the planet.osm.org site, there’s a download for all the changeets generated at the same time as the weekly “planet” file is created, and also one for all the changeets and discussions as well. The changesets-only one is just over 6GB (bzipped), and the one with discussions as well is only about 250MB more, because most changesets don’t have discussions.

If you’re not interested in changeset data dating back to 2012 you don’t need to download this file; you can just start replicating from whatever point in the past you are intereted in starting from.

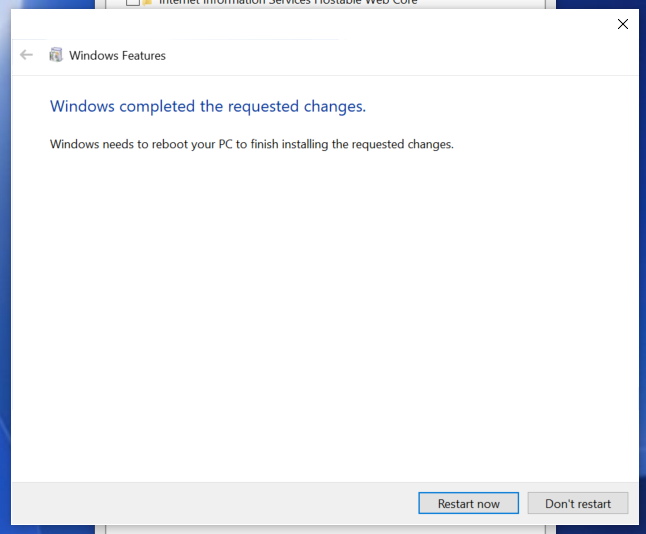
Installing the software

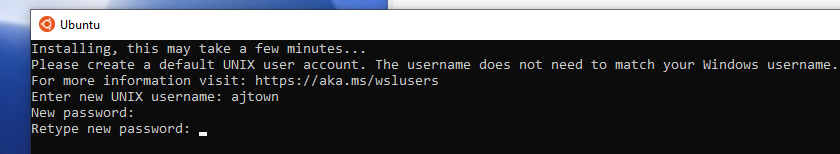
If you’re on Debian or Ubuntu, you’ll likely want to follow these instructions from a non-root user account of your choice (substitute that account for “youruseraccount” in the instructions).

Running it for the first time

From the virtual account created by the installation, which you can reenter by running

cd /home/${youruseraccount}/src/ChangesetMD
source .venv/bin/activate

Run something like this

python changesetmd.py -d changesets -c -g

The “-g” is optional and initialises the database to story geometric data. “changesets” in the line above is just the database name.

Loading a changeset dump file

To load the database with changesets and discussions:

python changesetmd.py -d changesets -g  -f ~/data/discussions-latest.osm.bz2

Adjust this to wherever you’ve downloaded discussions-latest.osm.bz2; if you are not interested in changeset discussions you can use changesets-latest.osm.bz2 instead.

Setting up replication

This section in the readme explains how to find out the date of the latest data you’ve imported from, and how to find out which replication file corresponds to that date.

Alternatively, if you haven’t loaded a dump file you might want to “just load all the changesets from the last year” - do do that find the state file in the replication directories that matches “about a year ago” and initialise the replication from there. To actually initialise the replication, do this:

cd /home/${youruseraccount}/src/ChangesetMD
source .venv/bin/activate
psql changesets
update osm_changeset_state set last_sequence = 5607928;

Again, “changesets” here is the database name. “5607928” is the replication number which will vary depending on where you want to start replication from. 5607928 corresponds to https://planet.osm.org/replication/changesets/005/607/928.state.txt , which is 18:43 UTC on 3rd August, 2023.

To run replication once, run this command

python changesetmd.py -d changesets -r -g

Again, “changesets” is just the database name and “-g” means “process geometry as well”. This will run though all pending replication files, which may take some time. You can monitor the process from psql by running “select * from osm_changeset_state;”. The “last_sequence” value is updated as it progresses but “last_timestamp” is only updated when replication is complete, so look at the former, not the latter.

When in progress the state table might look like:

changesets=> select * from osm_changeset_state ;
 last_sequence |       last_timestamp       | update_in_progress 
---------------+----------------------------+--------------------
       5607985 | 2023-08-02 00:59:46.096662 |                  1
(1 row)

when replication has completed, “update_in_progress” will be set to “0”.

Running replication from cron

A shall script “call_changesetmd_replication.sh” has been written to check that changeset replication is not already running, and if it is not to run it.

That is designed to be run from a cron job like this:

*/5 *   *   *   *    /usr/local/sbin/call_changesetmd_replication.sh >> /var/log/tiles/ChangesetMD.log

That runs every 5 minutes; the location /var/log/tiles/ was chosed for the log because if rendering database replication is already set up that’ll probably go there too.

Clearing replication flag at restart

A script “reset_changesetmd_replication.sh” has been written to do this. The version distributed in the script is written to sudo to the database owner from root, so that it can be run in a startup script somewhere.

What can it do

Counting changesets by a user

changesets=> select count(*) from osm_changeset where user_name = 'SomeoneElseSC';
 count 
-------
   2175
 (1 row)

Displaying details of changesets

changesets=> select id, num_changes, tags -> 'comment'  from osm_changeset where user_name = 'SomeoneElseSC' and created_at > '2023-08-01';
    id     | num_changes |                     ?column?                     
-----------+-------------+--------------------------------------------------
 139486735 |           2 | Determine roads lane count
 139486744 |           5 | Specify road surfaces
 139486795 |           2 | Specify whether public transport stops have bins
 139486799 |           2 | Add whether public transport stops are lit
 139486859 |           1 | Specify crossing types
 139486892 |           1 | Specify whether crosswalks have tactile paving
 139486897 |           1 | Specify cycle barrier types
 139486904 |           1 | Specify cycle barrier installation
(8 rows)

Changesets within an area

The “ST_MakeEnvelope” below is an area around “null island”:

changesets=> select id, user_name, tags -> 'comment' FROM osm_changeset c, (SELECT ST_SetSRID(ST_MakeEnvelope(-0.1,-0.1,0.1,0.1),4326) AS geom) s WHERE ST_CoveredBy(c.geom, s.geom) and created_at > '2023-06-01';
    id     |     user_name      |              ?column?               
-----------+--------------------+-------------------------------------
 137125242 | TV Sand in Taufers | 
 137125690 | TV Sand in Taufers | 
 137233374 | ivanbranco         | deleted null island drinking waters
(3 rows)

With different imagery sources

changesets=> select count(*) from osm_changeset where created_at > '2023-05-01 00:00:00' and created_at < '2023-06-01 00:00:00' and tags -> 'imagery_used' like '%Maxar%';
 count 
-------
 80407
(1 row)

changesets=> select count(*) from osm_changeset where created_at > '2023-05-01 00:00:00' and created_at < '2023-06-01 00:00:00' and tags -> 'imagery_used' like '%Bing%';
 count  
--------
 274372
(1 row)

With certain changeset comments

changesets=> select id, user_name, tags -> 'comment' from osm_changeset where tags -> 'comment' like '%muppetry%';
    id    |     user_name      |                                               ?column?                                                
----------+--------------------+-------------------------------------------------------------------------------------------------------
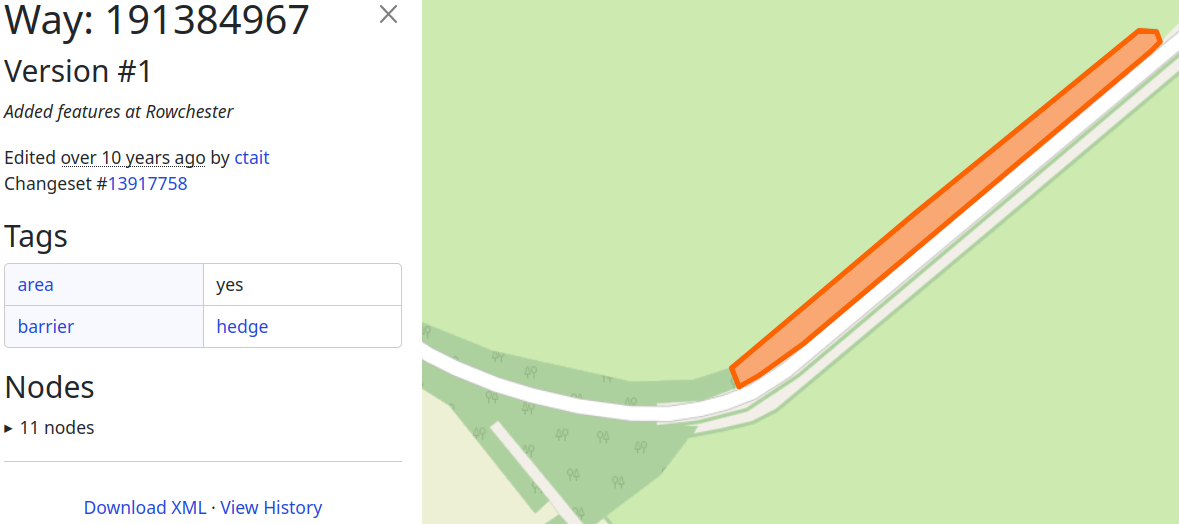
 27073588 | SomeoneElse        | Added a couple of hedges in the vicinity to try and prevent further armchair muppetry.
 67493564 | SomeoneElse_Revert | Revert more muppetry in USA.  See https://www.openstreetmap.org/user_blocks/2545 and previous blocks.
 45959206 | SomeoneElse        | Undoing more road merging muppetry
(3 rows)

(oops)

Changeset comments

changesets=> select * from osm_changeset_comment where comment_changeset_id = 126313717;
 comment_changeset_id | comment_user_id | comment_user_name |    comment_date     |                                                      comment_text                                                      
----------------------+-----------------+-------------------+---------------------+------------------------------------------------------------------------------------------------------------------------
            126313717 |            5359 | user_5359         | 2022-09-22 19:30:10 | Hello! Please have a look on http://overpass-turbo.eu/s/1m76. What is the meaning of the tag do = View from path;Bing?
            126313717 |           61942 | SomeoneElse       | 2022-09-22 19:39:35 | Thanks - just a typo, now fixed.
(2 rows)
Location: Charlesworth, Higher Chisworth, High Peak, Derbyshire, England, United Kingdom

For many years I’ve used Garmin devices for both for navigation and for collecting data for OSM. As well as lots of premade maps in different styles it’s actually pretty easy to tinker with the map style yourself, although the OSM wiki makes it seem much more complicated than it actually is. It’s also pretty easy to see what OSM keys map to what values - there’s a file for points, one for lines and one for polygons that shows what OSM key and value corresponds to what Garmin feature.

I also maintain a web map style that tries to be much more inclusive than other web maps in terms of what it shows (have a look around the map legend for that), and thought that it’d be great to do the same for Garmin maps too. The web map style uses a lua script to preprocess OSM data before the CartoCSS code deals with it, which makes the latter much, much simpler. It turns out that exactly the same approach works when creating Garmin maps too, as described on this page.

The resulting map style includes data from around 250 OSM keys and over 2000 OSM values, and browsing 3 text files to see what is shown as what is no longer an option. However, all of the OSM keys and values used by this project have been uploaded to taginfo, so we can use that for documentation. This page shows all the tags used. In each case, the “How this key/tag is used in the project” column has been updated with what extra processing happens to the item and which Garmin search menu it appears in. For example, if you search for shop=shoes you’ll see “shown in brackets; ‘Shopping / Apparel’”. “Shown in brackets” means the OSM tag value (“shoes”) is appended to the name on the devices so that it appeats as e.g. “Clarks (Shoes)”; “Shopping / Apparel” means it’s on the “Apparel” submenu on the “Shopping” main menu (the one you get to by pressing “Find” on the device). You can also search “tags used by this project” for either keys or values. See for example the search for “fish_and_chips” below, and see how all matching values are shown, and also that in some cases the search menus to use vary depending on whether the object is fast_food or a restaurant:

The other side of the coin to this is “for each Garmin menu item, which OSM keys and values appear on it”. That is listed in tables in a map legend here. As an example, you can see that the “Fast Food” submenu below “Food and Drink” is used for “Pie-led fast food”, which means “amenity=fast_food” and a “cuisine” value of any of “=pasties”, “pasty”, “cornish_pasty”, “pie” or “pies”.

That document also describes the special processing used for e.g. public footpaths, long distance hiking routes, quality control information (“is this road lit” etc.) and more.

Currently a build (of maps for Great Britain) is done every week, but producing maps for other areas is simple, given that the file to process is downloaded from Geofabrik at the top of the script - no other code changes.

Location: The Groves, Layerthorpe, York, England, YO31 8LR, United Kingdom

Screenshot of switch2osm page

I’ve added a new page to the switch2osm guide: “Manually building a tile server (Debian 12)”.

Mostly it’s minor changes only from Debian 11 and Ubuntu 22.04 - new versions of software, that sort of thing. Where new manual steps have to be carried out, the guide describes them. Debian 12 itself does have some differences - “syslog” is no longer created by default, so debugging changes slightly.

I’ve also updated a couple of other pages such as the replication ones to reflect that Debian 12 is now a supported operating system.

Separately to that, I’ve moved map.atownsend.org.uk (which uses a related may style) from an Ubuntu 22.04 server to a Debian 12 one. There was nothing wrong with the old one, but the hosting provider I use was offering higher spec ARM servers for essentially the same price as the old AMD one I was using, so it made sense to move.

Operational differences that I’ve noticed (apart from it just being faster, because it’s on a higher specification server) is that early morning low-zoom rerendering takes longer because more tiles are marked as dirty - the reason for this seems to be bugfixes within the osm2pgsql processes that handle replication.

Location: Thurles Townparks, Thurles Urban, The Municipal District of Thurles, County Tipperary, Munster, Ireland

Most hedges have been added to OpenStreetMap as lines. Most renderers show something like this:

hedge rendering 1 from wiki page

and everyone’s happy.

However, from the beginning of OSM, people have mapped some hedges as areas, so for example something like this:

hedge obviously mapped as area in OSM

is clearly meant to be an area. The map style at map.atownsend.org.uk inherited what “OSM Carto” did in 2014, which was to show linear hedges as lines (using one bit of code) and area hedges as areas (using another). This works fine here:

hedge obviously mapped as area on map

However, in some cases there are problems. In an osm2pgsql database, an object can only be either an area or a line, but not a bit of both. If a tag that is thought to apply only to lines is found on an area, it will be ignored. Another effect is that if a hedge is drawn around an obviously area object (a field, for example), then the hedge will also be considered an area, if hedge areas are “a thing” in that map style:

See for example here:

hedge drawn around a field

which results in this “very large area hedge”:

linear hedge shown as area by mistake

More details and links to previous discussion can be found on the github issue here. The solution was this - if another tag might be making the item into an area feature, assume that the hedge is linear, but if no other tag is doing that, assume that the hedge is an area.

This results in the correct rendering here:

linear hedge shown as area by mistake

As an aside, in 2019 OSM Carto removed support for area hedges, and numerous people complained about that change. The result is that OSM Carto gets the “field” one above right but fails basic tests such as the example at the top of this diary entry:

hedge shown incorrectly by OSM Carto

To be fair - it’s not entirely the OSM Carto developers’ fault - part of the problem is mappers combining “features they expect to be linear” and “features they expect to be areas”, and partly that is because OSM does not have an area data type.

Although it’s not perfect, the solution here is clearly a better one than what they went with.

As another aside, the mismapping of hedges with barrier=hedge; area=yes when (according to the imagery) they are clearly not hedge areas is a real problem. As an example, if you look at the imagery here you can see that’s clearly a field, not a very big hedge. However (before some enthusiast decides a mechanical edit is in order) not all of these are mistagged - this one is just a very big hedge.

For completeness, from a database count there are 5999 “area hedges” in UK/IE, and 3026 “linear hedges around other area features”. Some of those “area hedges” should probably be something else (for example, way 1086001254 is a bit of a stretch as a hedge), and some of those “linear hedges” might actually be areas if an area hedge is, say, it’s very own nature reserve.

Location: Selby, North Yorkshire, England, United Kingdom

As there have been lots of updates recently, I’ve made a new release of all of the code behind map.atownsend.org.uk

There are releases for four repositories - the lua code that does all the hard work, the map style that determines what it looks like, the map legend, and the website for the map itself.

Here’s a summary of what’s new:

Natural features

Rocky features are now shown in more detail:

I’ve been struggling for some time to get a distinct representation for different landuse features - scree different from bare_rock, for example. I finally came up with a series of different dot patterns that hopefully differentiates.

Tidal rocks, beaches and mud etc. are shown with blue dots:

The fact that OSMers mapped tidal sand and rock different to non-tidal was something of a surprise to me, but it is mapped consistently.

Prominent single rocks are shown in black:

climbing boulders with a green flash:

and that’s different again to artificial (for example, indoor) “climbing walls” that are shown in all green.

Historic and archaeological features

People who know more about the subject than me have labelled historic tagging in OSM as a bit of a mess. One basic problem is that different tags are used for graduations of the same thing, like these examples:

  • historic=castle
  • historic=ruins; ruins=castle
  • historic=archaeological_site; archaeological_site=fortification; fortification_type=castle

In addition, there are roughly three different parallel way to break down “historic=archaeological_site” -

  • archaeological_site/site_type=
  • fortification_type=
  • historic:civilization=* (and even then there’s variation, like “historic:period=*”)

Sometimes I’ve had to use these subtags to determine what things “really are”, so there are a lot of entries at taginfo where this map is the “only consumer” of certain types of data. The resulting tree diagram where multiple paths lead to the same branch is worth a separate discussion in its own right, but for now let’s just look at the pictures :) .

However, in amongst the confusion, it has been possible to show many more archaeological features individually, including stone circles:

More historic features have unique icons, like this monastery:

There are lots of other examples, as can be seen in the legend here:

Location: Seamer, Crossgates, North Yorkshire, England, United Kingdom

Community.osm.org - how's it going?

Posted by SomeoneElse on 25 March 2023 in English. Last updated on 28 March 2023.

The new forum “community.osm.org” has been going for a while now, so maybe it’s useful to have a look at how things are going.

There’s obviously lots that goes into creating that forum as a site where people can share ideas - there’s the forum software itself, and the people looking after the technical administration of the site, the migration of the old forum (which has just happened) and the help site (planned for later), the various implementation decisions that got us to here, and also the people looking after content moderation (which is more actively managed than before). Of all of these, this diary entry is really only about the Discourse software itself.

I’ll not comment here about the future migration of https://help.openstreetmap.org/ to Discourse and the work required within Discourse to support that, since it would be unfair to judge something that has not happened yet.

Full disclosure - I’m one of the moderators of a couple of categories in the forum, but this is very much a personal view.

What’s good:

The software is actively maintained, unlike the old FluxBB forum software, or OSQA, which is used for the help site.

It’s working! Some communities that might have been a bit quiet or spread over private forums are now able to talk together much easier than before.

Searching works, with some caveats around the UI (see below for that). This may sound obvious, but mailing lists search at for example talk-gb can be a bit of a pain to use - a page such as this only shows the subject and the name of the poster, not the date of the message.

You can avoid “me too” answers (but see “reaction icons” below).

There’s a translate button on every post that supports the most common languages. This reduces the “echo chamber” effect that some forums had previously (and some other OSM channels still do now).

For browsing and reading, most things work on mobile. Initial login is slow, but it works (usually, eventually). It’s certainly better than OSQA which is not at all easy to use on mobile and needs a lot of zooming in and zooming out.

The barrier to entry is much lower than e.g. Telegram. If you have an OSM account, you can log in. You don’t need to e.g. provide a mobile phone number to a third party that you do not necessarily trust.

You can do most things by email (with caveats). See here and here. Email threading was nonexistent in received emails before a recent Discourse upgrade, but this has now been fixed.

You can automatically upload pictures without needing a separate hosting site (unlike, say, mailing lists).

You can use tags as “virtual categories” and post using them. It’s a bit complicated, and new users are never going to figure it out on their own, but it does have the potential to be a useful feature. This is a virtual “United Kingdom” category below “general” and this is a virtual Garmin one.

What’s bad:

The Site layout is poor. https://community.openstreetmap.org/ shows a couple of massive icons, some verbiage and half a dozen links (three on mobile). The remaining 40-odd forums (where most people hang out) are “below the fold” and in no particular order. See also here for more about that.

The forum structure is quite limited, although this may be an implementation decision. Replying by email can cause issues with quoting - depending on the email client, sometimes all of the previous messages is quoted again.

Composing messages on mobile (Firefox) is challenging.

The moderation approach is somewhat restricted by the tools available. When something is reported various messages and numbers are shown but it is not at all clear (except from experience) what applies to the person doing the reporting and what to the person reported. Also, some moderators have complained that they can’t do what they expect to be able to (i.e. not what they were able to do on the old forum).

I know that computer systems tend not to be, but it does seem to be random in places. What one user sees does not match what another user sees.

Pages are slow to load. A 4-second load time (even on a mobile phone) over a fast Internet connection in 2023 is simply ridiculous. See here for more.

It sounds basic, but it’s not possible to see who a reply was to. This is particularly a problem by email, where persons A, B and C reply. If C replies to B there’s nothing (even on the web UI) to indicate that. If B’s reply to A wasn’t visible by email (perhaps because of a local email filter) then it looks like C is replying to A. I mostly work around this by, where relevant, always quoting a bit of message to reply to - that way it’s obvious. See also here and here.

Although searching mostly works, the UI around searching is pretty “user hostile”. To see this, go here and press ^f (normally an in-page browser search) and that keypress is intercepted by Discourse and you are shown “find in topic” instead, which “simply doesn’t find” lots of text. Try searching for “persistent and stable” and it’ll say “no results found” Then browse to here and scroll up a bit, and you can see that that text exists. You can click on it to see the posts, but you can’t search for it. You can press ^F twice and search within page, but because Discourse doesn’t send the whole page to the browser, that search does not work from the top of the page - it’s well into “chocolate teapot” territory. See also here.

The back button does not work.

Users find minimum post length annoying.

The reaction icons are very limited - high on emotion, low on feedback. There is no “vote down” option, which will be essential for “help” migration. There is also no “that’s a really useful comment but I don’t agree with all of it”.

What’s just ugly:

The documentation is piss-poor. See also here for another example of functionality that appears to have been designed under the influence of recreational pharmaceuticals. There’s an about link (which says who the admins and moderators are) and an FAQ (which seems primarily concerned with etiquette guidelines). There is Discourse’s searchable “meta” site (which is good, but you are only going to look for it if you know that such a thing is likely to exist).

The best documentation we have seems to be this which is an introduction to Discourse for OSMers by OSMers. It’s written in German, but you can translate it using Discourse’s built-in translation button..

The upstream release process is a mess. Normally new versions of computer software are “released”. In mid-January a more appropriate zoo analogy would be to say that Version 3 of Discourse “escaped”.

Edit: Link to here removed as that issue is now fixed.

Edit 2: A couple of extra “good” points added - picture hosting and virtual categories.

Location: Lunyo Estate, Katabi, Virus, Entebbe City, Central Region, Uganda

Windows Subsystem for Linux

Posted by SomeoneElse on 25 January 2023 in English. Last updated on 30 March 2023.

This isn’t directly related to OSM, but many times in “software” or “development” OSM channels someone has asked “how do I do X … on Windows 10?”.

The reason that’s often a question is that, for historical reasons, much of the OSM software used to do things has been developed on Linux. That’s great for people working on Linux themselves, and the Apple Macintosh users can normally jury-rig something to run that software too.

Windows users can do the same too, by installing “Windows Subsystem for Linux”. Within Windows, search for “Windows Features”:

In Windows Features, tick the box for WSL and click OK:

Windows will want to restart

After the reboot, search for “Ubuntu”:

As noted in the comments, you may need to add “Ubuntu 22.04.1 LTS” from the Microsoft App Store here. When I deleted and reinstalled WSL and Ubuntu to create these notes, I didn’t need to - but it may be that a Microsoft uninstall didn’t do a clean uninstall. Plus ça Change, eh? :)

Ubuntu will install:

and will then prompt for a userid and password:

After that type “lsb_release -a” at the prompt to see the version installed:

No LSB modules are available.
Distributor ID: Ubuntu
Description:    Ubuntu 22.04.2 LTS
Release:        22.04
Codename:       jammy

Apply any pending updates:

sudo apt update
sudo apt upgrade

(this will take a while the first time)

and you can then head over to e.g. https://switch2osm.org/serving-tiles/ to do whatever it was you wanted to do.

When is a path not a path?

Posted by SomeoneElse on 16 January 2023 in English.

Just after the New Year, there were a few reports of people getting stuck and having to be rescued while hiking in the English Lake District.

There are writeups of this in “The Great Outdoors” magazine here and on Alex Roddie’s blog here. They really are worth reading - the consensus on IRC, Mastodon etc. was that the quality of the article was streets ahead of what you might expect to see in the generalist national press.

Lots has been written about how map and app developers can try and convey information to a user beyond “this is a way of getting from A to B” (including an OSM diary entry that I wrote in December 2022), so I won’t go over that again.

However, one particular quote from the Great Outdoors article did stand out for me, and it’s this:

A spokesperson for Keswick Mountain Rescue Team, which carried out the rescues, said: “There is no path via this route – only a scramble of loose scree which also requires the walker to negotiate the rocky outcrop of Slape Crag. It’s the scene of previous callouts.”

The reason why that stood out is that “path” can mean different things to different people:

  • an actual signed path suggesting that people on foot are encouraged to go via a particular route. In England and Wales there’s the concept of “public footpaths” (and public bridleways), which is a legal right of foot (and horse) access across what might be otherwise private land.

  • some indication on the ground that people often go via a particular route

Often the two coincide, and “where you’re supposed to go” matches “where people do actually go” correspond. Sometimes, however they don’t.

As an example, let’s imagine you want to go from the road north of Carlton near Helmsley to the old ruined buildings at Stork House, across the moor. That’s on Ordnance Survey map OL26, and you can also see that mapping at Bing maps here. You’re expecting the public bridleway to follow a track until a small bridge and then head left across moorland to Stork House.

At the western end there’s a public bridleway sign: Picture

and the track is pretty clear: Picture

So off we go, accompanied by the calls of local grouse letting everyone know there is someone unexpected around. Soon, however, there is a bit of a problem - there’s no path visible northeast from the bridge

Picture

Picture

and there’s no “public bridleway” signage. Let’s carry on along the track for now. As the OS 1:25k maps attest, the moorland area is all access land, so public access on foot is allowed. Eventually we get to the guidepost here:

Picture

Picture

Although the paint has mostly worn off, it’s just about discernable as a “public bridleway” sign (well, it was last year when I first mapped it - a year later when I took these pictures it’s a bit less obvious). From there, the path that we need to take to get to Stork House is clear:

Picture

Soon, we can see the ruin of Stork House:

Picture

Not visible in that picture are the rabbits that scattered as soon as I walked down the hill. Eventually, we reach the point where the alleged bridleway that didn’t exist on the ground “joins” the path that we’re on:

Picture

That Garmin picture shows an OSM-derived map that I created superimposed over OS Explorer Mapping. The green dashes are the alleged bridleway, the brown dashes are OSM paths, and the blue line is the route I’ve walked. So is there any sign of the bridleway marked on OS’ mapping from this side?

Not really:

Picture

In that picture, the path we’ve walked in on from the southeast is on the left, and the bridleway route would go across the moorland to the right. There’s nothing obvious there. If we go through the gate into Stork House itself we can see that there are two plastic “public bridleway” signs:

Picture

The blue colour has almost entirely worn off so the direction shown isn’t clear, but one presumably points back the way we came and the other to the northwest, where we’re expecting another bridleway to go.

In conclusion

One thing that I think we can say is that the non-existent-on-the-ground public bridleway doesn’t belong in OSM as any sort of path, as there simply isn’t a path on the ground there. Had there been fingerposts across open moorland then that probably would have been worth adding (perhap with a “trail_visibility=no” tag), but as there’s not even that, it’s really not worth adding as a path, despite appearing on OS maps and (in this area) being available from the local authority under an OSM-compatible licence.

As an aside on “trail_visibility”, it has been used around here. For example, the path across the road from where we started from is here:

Picture

Picture

and isn’t very clear on the ground either, hence the “trail_visibility” tag on it.

The second conclusion is that “on the ground legal signage” of routes can diff from what the local authority thinks the route ought to be, and where it does, and seems on survey to be “more correct” then it’s best that OSM reflects that, rather than the local authority’s view. That’s why, in OSM, I’ve marked the signed route a the bridleway (the blue dashes and dots here. The red line on that map is the overlay of local authority rights of way. Turn that off and you’re looking at data from OSM only.

Copyrights etc. in maps and screenshots:

  • OSM map data wherever it appears is © OpenStreetMap contributors
  • PRoW overlay data is © local authorities under OGL & rowmaps.com
  • The Bing map is labelled by Bing as © 2023 Microsoft
  • The OS data on the Garmin picture is Ordnance Survey © Copyright 2023
Location: Old Kiln, Helmsley, North Yorkshire, England, YO62 5HJ, United Kingdom

How to show paths on a map?

Posted by SomeoneElse on 11 December 2022 in English.

(or, what’s wrong with the general purpose map on my phone that just seems designed just to show me adverts?)

I decided to write this after reading some of the comments on the wiki here and in the community forum here.

People tend to view “things that appear on a map” as “somewhere that they can go”. For example here:

A stroll up Everest

someone who didn’t do their research properly might think that they can just wander along that path to the top of Everest from the south, despite the underlying data suggesting “difficult alpine hiking”. This diary entry is an attempt to try and avoid such misunderstandings.

What options does a map have to different things?

The map at map.atownsend.org.uk shows linear paths and tracks as a single line, It shows legal rights of way (some special categories in England and Wales) and also tries to give some indication of what a walker might expect on that path.

First, before we talk about “showing what a walker might expect”, a note on what options maps have to show linear things differently:

  • colour
  • width of line
  • pattern along the line
  • other things drawn alongside the line

How are those shown?

The colour of the line is used for the legal designation - brown for “motor-vehicley” ones, blue for “horsey or cycley” and red for “foot only” and grey for no legal designation, like this:

Colours for car, horse, foot

In addition, an overlay colour is used for access rights:

Colours for access

The width of the line is only used to control the “visual weight” of features on the final map - it’s tuned by colour at each zoom level, so that a particular sort of feature does not dominate the map at that zoom level.

The spacing of the pattern along the line shows the width of the path (widely spaced for wider than 2m, narrow spaced for less than):

Patterns for path width

Also, slightly different patterns are used for some slightly different legal designations (for example, bridleways and restricted byways).

“Other things drawn alongside the line” are used for tunnels, long fords, bridges and embankments, for example:

Bridges and embankments

What other OSM tags do we want to show?

informal” is sometimes used to show that a path has been created by users rather than by sanctioned by land managers. This only makes sense in places where there are formal paths (which isn’t everywhere), and an informal path isn’t necessarily in any way illegal to use.

trail_visibility” is used to indicate how easy it is to see a path on the ground.

sac_scale” is used to show how difficult a path is to use.

The first two are essentially about showing that a particular path might be difficult to see, or that a walker might not want to follow it because it’s not an “official path”; the third is about how to show (and in some cases not to show at all) paths that might actually be dangerous to an unsuspecting walker.

A final tag that isn’t shown is smoothness. Unlike other modes of transport, a low sac_scale path won’t become impassable to most pedestrians because it’s not very smooth.

What is actually the goal of this map style?

It’s designed to show all legal rights of way there is an actual path (theoretical routes exist where there isn’t really a path - the walk across Morecambe Bay is one example).

Paths that are difficult (high SAC scale), informal or not very visible are de-emphasised in the rendering.

Very difficult paths and very poor visibiliry paths that are not public rights of way are suppressed from the default rendering; an overlay is available for these.

What does this mean in practice?

Here’s a section of bridleway in the North Yorkshire Moors with a “trail_visibility=bad” section in the middle:

Less visible bridleway

An informal human-created shortcut off the Foss Islands Track in York

Informal path

West of Sca Fell, with “difficult” paths excluded by default:

West of Sca Fell

The same view, but with the overlay of “difficult” paths turned on:

with difficult paths

The net result is that

  • walkers who see a path on the map will see a path on the ground
  • paths that are less clear on the ground will be de-emphasised on the map
Location: Isle of Wight Donkey Sanctuary, Ventnor, Isle of Wight, England, PO38 3AA, United Kingdom

Permalinks at map.atownsend.org.uk

Posted by SomeoneElse on 4 December 2022 in English.

The problem

Historically, the map at map.atownsend.org.uk didn’t change the URL as you moved around, and you had to press a “permalink” button to save the current location. This wasn’t ideal, so I had a look around for alternatives. Helpfully, the Leaflet site has a list of suitable plugins. Of those, leaflet-hash was suggested elsewhere. That seems to be still in use, although it hasn’t been updated for a while. It is spectaculary easy to use, and “does what it does” with no problems.

The challenge is that it stores the current location (for example “https://map.atownsend.org.uk/maps/map/map.html#11/54.4900/-3.1098”) but doesn’t store the current layer. That map currently has a choice of 5 base maps (test instances have 6) and 5 overlays:

Layer selector

How to solve this

I had a look for an alternative, and the nearest that I could find was leaflet-hash-plus. The hosting of that seems not to be there at the moment, so the demo does not currently work, but the code does (if you host it yourself). It’s a bit “some assembly required” though - the way it works is that it allows you to encode layer information in a “meta” array and store and retrieve that when needed, which is a bit of a challenge for someone who (like me) isn’t a Javascript developer.

To do that, I need to add handlers for events so that the code knows when the base layer changes or when overlays are added or removed.

The “meta” that I use is just a list of layers, so “HPN” would mean that the default base layer is used, together with the “LA_PRoW” (“P”) and “No vis paths” (“N”) overlays. When the URL changes, the code must change the displayed layers to match. When layers are changed manually using the layer selector, the URL must change. The code makes sure that only one base layer is selected, and overlay layers are removed as required. The mapping between tile layer URLs and the representation in the current site URL is handled here.

What we can now do

West of Scafell Pike

The URL https://map.atownsend.org.uk/maps/map/map.html#16/54.4540/-3.2155/H/N turns on the “No vis paths” layer so that this path appears. It’s suppressed by default on the default layer because “sac_scale” is set to “demanding_mountain_hiking” and “trail_visibility” is set to “bad”, and it doesn’t have a designation tag on it.

UK/IE/IOM boundary

Boundaries are turned off by default, but a URL of https://map.atownsend.org.uk/maps/map/map.html#8/54.143/-4.878/H/B turns them on.

Jugger Howe

This (https://map.atownsend.org.uk/maps/map/map.html#15/54.3771/-0.5528/H/P/N) shows an overlay of the legal rights of way over surveyed paths of varying visibility, and how they significantly differ from what is actually there.

Location: LCPs of Fylingdales and Hawsker-cum-Stainsacre, North Yorkshire, England, YO22 4QB, United Kingdom

Garmin GPSMap64S screenshot

The OSM wiki contains links to various downloads for Garmin maps, as well as some information about creating your own from OSM data.

For many years now I’ve used maps on Garmin devices that I’ve created myself. I’ve done this so that I show things like England and Wales public footpaths and bridleways that I’m not aware that other maps can show. Until now, I’ve never quite got around to making the mechanism publicly available, or indeed the maps themselves. I’ve finally got around to fixing that.

The “readme” here explains how to run the script yourself, if you want to do that. If you don’t, you can download the latest files for Great Britain. New maps should appear there about weekly.

Differences between these maps and other maps for Garmin devices include:

  • They’re routable. Many maps for Garmin devices are, but not all.
  • Public Footpaths have “(FF)” added to the end of the name, or used instead of the name if there was none.
  • Public Bridleways, Restricted Byways and Byways Open to All Taffic similarly add “(FB)”, “(RB)” or “(BY)”.
  • Members of foot and hiking routes have the name of the routes in brackets after the road name, if any.
  • Ways inaccessible on foot (private tracks etc.) are removed from the map.
  • Pubs and bars selling real ale have “PQR” appending to the name

Some of these mirror how things are represented on maps at map.atownsend.org.uk. Those maps use osm2pgsql, osmium, osm-tags-transform and lua scripts to determine what is shown on the map.

These Garmin maps currently only use mkgmap style files such as this one, which isn’t quite as flexible. Eventually I may get a chance to change that and do more of the transformations in lua which should and also allow more precise changes to be made, and also reduce the size of the style files,

Location: Whenby Lodge South, Sheriff Hutton, North Yorkshire, England, YO60 6QN, United Kingdom

Switch2OSM.org Serving Tiles - Updating your database as people edit

Posted by SomeoneElse on 26 July 2022 in English. Last updated on 27 July 2022.

Munin

Since the release of Ubuntu 22.04 LTS, it’s now much easier to keep a tile-serving database updated. This version of Ubuntu ships with much more recent versions of osm2pgsql and osmium, so it’s easier to set up updates using those.

First things first, the new “setting up a rendering server” instructions for Ubuntu 22.04 are here. These are much shorter than they used to be because most of the software setup is done automatically as it is installed.

osm2pgsql-replication

The first option is to use osm2pgsql-replication. The manual page for this is here. The switch2osm page walks you through initialising replication, and creating scripts to apply updates and mark tiles as “dirty”, so that they will get rerendered as required when the underlying data has changed. Download sites such as Geofabrik and download.openstreetmap.fr provide extracts and replication feeds for those extracts - for example, you can load data for Europe, and then apply updates only for Europe - your database will not grow with other updates from all around the world.

PyOsmium

Another option, slightly more flexible, is to use Pyosmium. The documentation for this is here. Again, the switch2osm page walks you through initialising replication, and creating scripts to apply updates and mark tiles as “dirty”, so that they will get rerendered as required when the underlying data has changed. Example scripts are provided that use Zverik’s trim_osm.py script to cut-down replication update files to the area that you’re interested in.

A script to measure that measures the current replication lag and a script to call that from munin are also included.

Alternatives

Osmosis

Using osmosis should still work with Ubuntu 22.04, but comes with rather more dependencies.

Using osm2pgsql-replication or Pyosmium in earlier releases

This should also be posible if you build from source.

Location: Crossmoyle, Clones Urban ED, Ballybay-Clones Municipal District, County Monaghan, Ulster, Ireland

It’s been a while since I wrote about updates here.

Map.atownsend.org.uk is a map style that started out as a fork of OSM Carto in 2014, when it was obvious that the direction of travel for that style was towards “a map that was nice to look at” rather than “a map that was useful”.

For example, here’s the area that I linked to then in OSM Carto now: Kelstedge on OSM Carto

and here it is at map.atownsend.org.uk: Kelstedge showing more information

A key difference is the ability to see a walking route from one side of that map to the other.

The map style is in github - see the links at the top of the changelog. It’s designed to be a pedestrian-focused style, in particular showing England and Wales’ “public rights of way”.

From a design point of view, one of the key choices was to try and overload basic features with more detail. An example of that was described previously here. With the pubs that that diary entry describes, 8 different attributes are considered (“does it serve food”, “can I get a wheelchair in there”, etc.). There are now about 300 different combinations, but they’re all recognisably variations of the same basic icon. It’s a similar story with footpaths and paths - there are about 50 variations of those.

Technically, the approach taken was to lean heavily on lua tag transforms - invoked when the database is reloaded and also when data is loaded into it on the fly (the site applies updates every minute). Changes to the style that involve lua (and most do) do need a database reload. This is normally done once a month or so, and takes a few hours overnight - if 24*7 uptime was needed it’d be easy to switch between a pair of databases or servers (people with very long memories might remember the A/B approach of system like IBM’s System/38), but that hasn’t been a priority so far.

Making extensive use of lua has huge advantages - it makes the styling code much easier to write, since there need to be fewer complicated and brittle selection statements in the styling code. As an example, look at the code added to render parcel lockers in 2017. At the time, before “amenity=parcel_locker” was widely used, variations on vending machine tended to be used. The corresponding rendering code change is then really simple - just the reference to an icon and a name. It would also be possible to refactor the main two parts of the style to make far more use of this and vastly simplify much of the selection logic from the original style, but that hasn’t been a priority.

Another thing that lua processing makes easy is the ability to show walking, cycling and horse riding routes - the lua code adds tags so that the rendering code can render them a a dotted line. For my money (used as I am to other familiar UK map styles) these are absolutely a key part of a general purpose map.

With that in mind, it’s worth looking at some of the changes since the changes made to show zero-waste shops using a small “E” as a modifier to existing shop icons, described in a previous diary entry.

Many former phoneboxes now contain defibrillators, mini-libraries. tourist information points, etc. These are shown using a unique, but phonebox-derived, icon. Phone boxes that aren’t red are shown with an appropriate colour:

Green phone box

Stations on preserved and miniature railways are shown with the name in “tourist” colour. Grosmont has two stations, one on the national rail network, one on the preserved North Yorkshire Moors Railway:

Two stations in Grosmont

If a walking route has no name but does have a colour, the colour is used as the name:

red and brown walking routes

The style already used the trail_visibility tag to render some paths and tracks less overtly; this has been extended to also include various informal and overgrown paths. In this example an informal north-south link path is shown; as is a section of razed railway, with slightly different dots:

informal north-south link path

Some mappers have been mapping closed shops etc. with “opening_hours=closed

closed pub

Locked gates are shown with a “locked” variation on the gate icon:

locked gate

Footpaths and cycleways alongside a road are often tagged with the name of the road. This map style supresses this names, and “is_sidepath” has been added to the list of tags that forces this removal. For example, the tags here:

way 901462422 via overpass

show like this:

way 901462422 at map.atownsend.org.uk

The context of this diary entry is of course lots of discussions about OSM’s “standard” style, “OSM Carto”, particularly this bin fire of a pull request. One of the maintainers has written in detail about the process of changing the style here and especially here. As an aside, I disagree with a couple of the points there, in particular “we outgrew the possibilities of the technical framework we were using” - two of the three pinned issues here are essentially “as yet unexploited technical possibilities”. I’d also suggest that more widespread lua use, which I’ve tried to suggest the benefits of above, would be hugely beneficial if it was to be made use of.

That said, the triangle in imagico’s blogpost explains the conflicting pulls on the project, and I actually believe that the maintainers of OSM Carto have an impossible job, because the cartography guide contains these as the first two goals:

  • It’s an important feedback mechanism for mappers to validate their edits and helps to prevent unfavorable fragmentation of tag use.
  • It’s a major part of the public face of OpenStreetMap, for many people the map on osm.org rendered with this style is OpenStreetMap.

I believe that these have been in conflict for a long time (it’s essentially the problem I commented on in 2014). Both requirements are important but (as I’ve said elsewhere) I don’t believe that one style can meet both. We used to have a “show everything” style (Osmarender) that prioritised detail over cartography. Right now we have the data layer:

OSM data layer

but that relies on individual objects rendered by the browser client and simply isn’t practical at anything other than the highest zoom levels. At osm.org we currently have 6 map layers - “OSM Carto”, two cycle maps, two public transport layers, and the “Humanitarian” layer. Arguably none of them satisfy OSM Carto’s “important feedback mechanism” goal.

For completeness, it’s also worth mentioning the OWG’s “New Tile Layer” policy here - interestingly, complementing the existing osm.org map styles isn’t one of the hard criteria set out there, although soft criteria are that it should be “unique” and “interesting”.

Location: Opportunity, Holt County, Nebraska, United States

Zero-waste Shops

Posted by SomeoneElse on 13 February 2022 in English. Last updated on 1 June 2022.

Food shop icons with 3 zero-waste versions

Over at map.atownsend.org.uk I use a wider variety of icons for different sorts of objects within OSM. I previously explained here how simple changes to a basic icon make it still recognisable as the basic object (“this is a pub”) but also convey more information (“this particular pub is wheelchair accessible, and has a beer garden”).

The same principle can be used with “shop” icons - a selection of different types of shops can be shown differently if they have one of the tags commonly used in OSM to indicate “zero waste” or “eco” shops. This is done here in the lua file that processes all OSM data before loading into the rendering database. In the case of “zero waste supermarkets”, the code looks like this:

if ((  keyvalues["shop"]               == "supermarket"         ) and
    (( keyvalues["zero_waste"]         == "yes"                )  or
     ( keyvalues["zero_waste"]         == "only"               )  or
     ( keyvalues["bulk_purchase"]      == "yes"                )  or
     ( keyvalues["reusable_packaging"] == "yes"                ))) then
   keyvalues["shop"] = "ecosupermarket"
end

Then all that we need to do is to create a new icon and make sure that that icon is used:

[shop = 'ecosupermarket'][zoom >= 16]::shop {
  point-file: url('symbols/shop_ecosupermarket.p.16.png');
  point-placement: interior;
}

and that the name for “ecosupermarkets” is displayed just like it is for “supermarkets”:

[shop = 'supermarket']::shop,
[shop = 'ecosupermarket']::shop,
[shop = 'department_store']::shop {
  [zoom >= 16] {
    text-name: "[name]";
    text-size: 9;
    [zoom >= 20] { text-size: 18; }
    text-dy: 11;
    text-fill: #939;
    text-face-name: @book-fonts;
    text-halo-radius: 1;
    text-wrap-width: 20;
    text-placement: interior;
  }
}

The “lua” script is called for every object whenever the database is reloaded, and also called every time it is updated with whatever people have edited in OSM, which typically happens 5 minutes or so after the edit takes place.

Location: Woodhouse Cliff, Hyde Park, Leeds, West Yorkshire, England, LS6 2EZ, United Kingdom

Flood-prone footpaths

Posted by SomeoneElse on 2 January 2022 in English.

One example footpath, shown in blue as flooded

In England, the Environment Agency has an extensive network of river level monitors that are used to provide flood warnings such as (at the time of writing) this one.

However, these alerts tend to be only issued when land or property is likely to flood, and there are many paths that flood much earlier. An example is here, where if the downstream station reads just over 1m, you’ll get your feet wet. The Environment Agency doesn’t issue a warning at that level because it’s well within the normal range, and the river’s still well within the levees that have been provided for it for the last 50 years.

It’d therefore be useful to know which paths are likely to be flooded, and this can be done by noting what upstream and downstream measured levels were when a path was or was not flooded. In this case the downstream level is the more reliable indicator since lots of land drains empty into the river below the upstream station and there’s nowhere for the water to go before the downstream one. This has to be done on a case-by-case basis; EA’s flood maps are great for predicting low-level land that’s at risk but don’t have enough granularity to help here.

I’ve done this here. The map is a simple overlay available at https://map.atownsend.org.uk/, and it’s currently using the same database as the normal map there. The “is it currently flooded” information is obtained from EA’s station information every few hours (and station data is cached locally to avoid multiple unnecessary reads of that site). When a path is flooded, it shows in blue, as can be seen above. The overlay tiles are removed before each resample to avoid any tile caching issues. This map isn’t designed to replace EA’s own maps - when there are warnings of property flooding many areas where I’ve never measured “path X floods when station Y reads Z” will be affected.

Currently the comparison data is in the script itself not in OSM - I did ask about how it might be possible to do that earlier, but the replies seem to mostly miss the point that I was actually already recording “is it flooded or not here” rather than just guessing current flooding issues based on EA station values. It it proves useful to add more data it might be worth moving the comparison values into OSM itself (in the spirit of “any tags you like”), but that’s not a priority.

This approach won’t work everywhere. Nearby, Clifton Ings is one of many areas regularly deliberately flooded as part of flood prevention measures, but someone literally has to open a barrier to let water in and open another one to let water out - and presumably that is based on a mix of current and predicted future rivel levels, in turn based on previous and predicted rainfall elsewhere.

Location: Huntington, York, England, United Kingdom

Screenshot of Ubuntu release page

I’ve added a new page to the switch2osm guide: “Manually building a tile server (Ubuntu 21.04)”. The work that the Debian developers have done to include the required software inside Debian 11 is now in Ubuntu 21.04, so there’s actually less setup work needed than in previous Ubuntu versions.

Ubuntu 21.04 isn’t an LTS release, so Debian 11 or Ubuntu 20.04 are still the recommended options for servers that are expected to stay around for a while. One of the regular faux pas with the Natural Earth download site has just been and gone, but the guide includes a workaround in case problems reoccur there.

Unrelated to Ubuntu 21.04 directly, there’s currently a bit of an issue with the lack of feedback that part of the OpenStreetMap Carto setup gives to the user, but work is under way to improve that (I hope things will be able to return to where they were last year with this). I’ve tried to explain here and in the other guides that it’s to be expected that “things just go quiet for up to an hour”, and that eventually it will complete.

Location: Southwest, Derwent Valley, Tasmania, Australia

Checking for changes to Long Distance Paths

Posted by SomeoneElse on 30 July 2021 in English. Last updated on 15 October 2021.

Lyke Wake Walk relation in OSM - ways and nodes

Previously I wrote about checking National Parks in Britain and Ireland for breakage, by counting the number of valid polygons in a rendering database.

A similar approach can also be used to check line features as well as polygons. It’s possible to count the number of contiguous sections of a given polygon. For example, here’s the Lyke Wake Walk, which is in one piece:

psql -d gis -c "SELECT count(*) FROM planet_osm_line WHERE (osm_id = '-1996318');"
 count 
-------
     2
(1 row)

and here is the Sabrina Way, which isn’t:

psql -d gis -c "SELECT count(*) FROM planet_osm_line WHERE (osm_id = '-537430');"
 count 
-------
    12
(1 row)

If something is changed in OSM that introduces an extra piece, or fixes a gap, that number will change. This script can be used to count the change in the number, like this:

Change in relation components for Sabrina_Way 537430
3c3
<     12
---
>     13

If run from cron it can check every day and will only send an email alert when the number changes.

If there is a change, and can be investigated with a site such as http://ra.osmsurround.org/analyzeMap?relationId=6361532.

Edit 2: Also useful is the answer to this help question that looks for modified ways that make up a relation.

Edit 1: Where this process falls down is where a very long-distance path is added a superrelation and there’s a gap between the relations, which is what this changeset was fixing. Here two long several relations make up two super-relations that share some of their route. For completeness, the edit that I was fixing that created a gap in the Cleveland Way was actually fixing a previous edit of mine that introduced an unwanted spur to E2 at this location.

Location: Stainton Hall Farm, Danby, North Yorkshire, England, YO21 2JH, United Kingdom