What's new on the maps at map.atownsend.org.uk
Posted by SomeoneElse on 28 December 2023 in English. Last updated on 6 February 2024.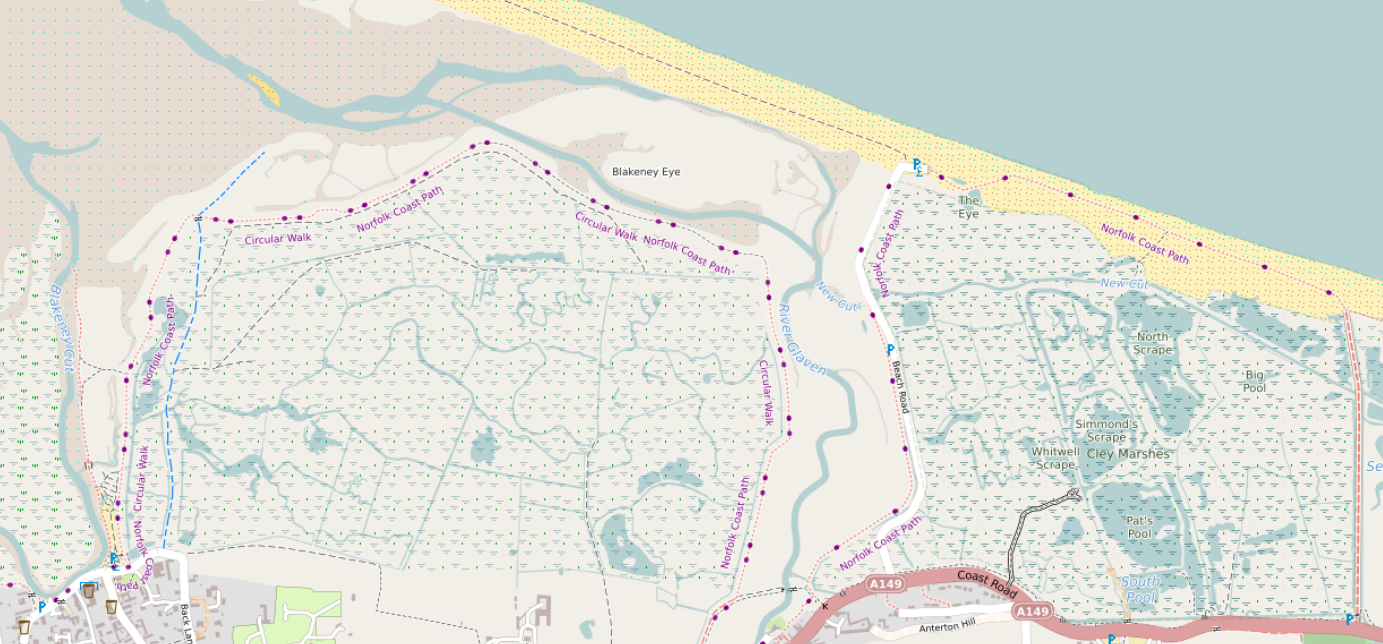
Tidal and non-tidal wetland
A major rewrite here takes into account tags such as natural, reef, wetland, surface and tidal before deciding how to show wetland areas. See the picture above, which is here, and here in OSM.
The beach between high and low tide can be clearly seen here (in OSM, here). There are blue dots in the sand rather than black. A deliberate decision was taken to show more detail for areas above low tide. See e.g. here between Wales and the Wirral (see here in OSM).
Island and islet names
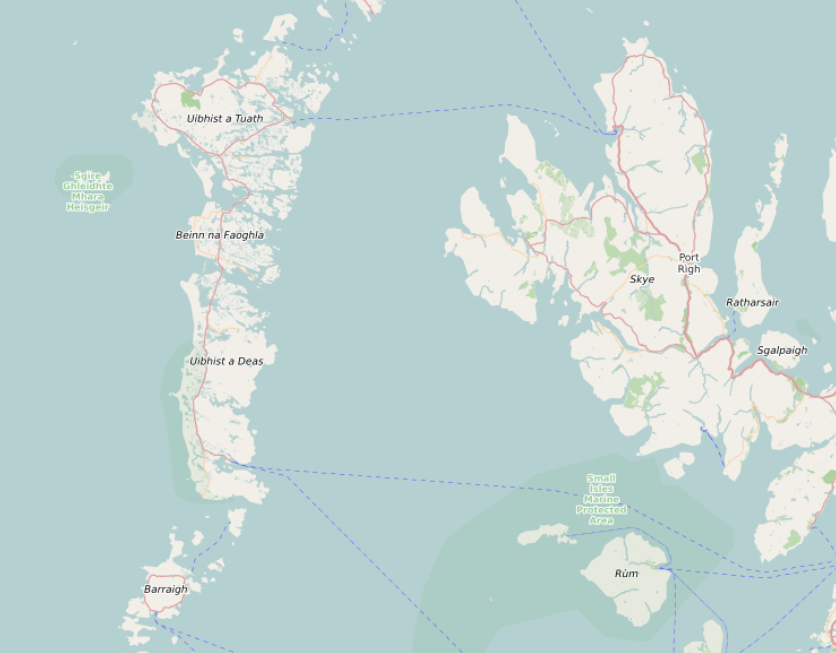
Island and islet names are shown based on their size. Try going here and then zooming out - small island names disappear first, with the larger ones such as Skye disappearing much later.
Width of rivers and streams
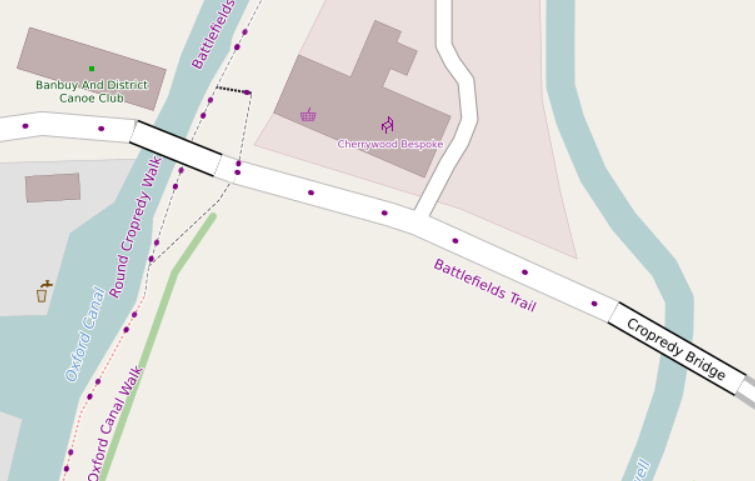
Many rivers and streams don’t have water areas mapped for them, which means that maps have to decide what to do at higher zoom levels. The Cherwell on the right on the picture above is an example of that. For rivers and canals, I’ve tried to match what “the actual width of a small river” might be. For an example, see here just up-river from the previous picture. At high zoom levels, the river’s width is about the same fraction of the bridge length. If you look at the imagery here you’ll see that the width is about right.
The same principle is applied to streams, drains and ditches, although of course they are narrower.
Cycle routes, National Byway etc.
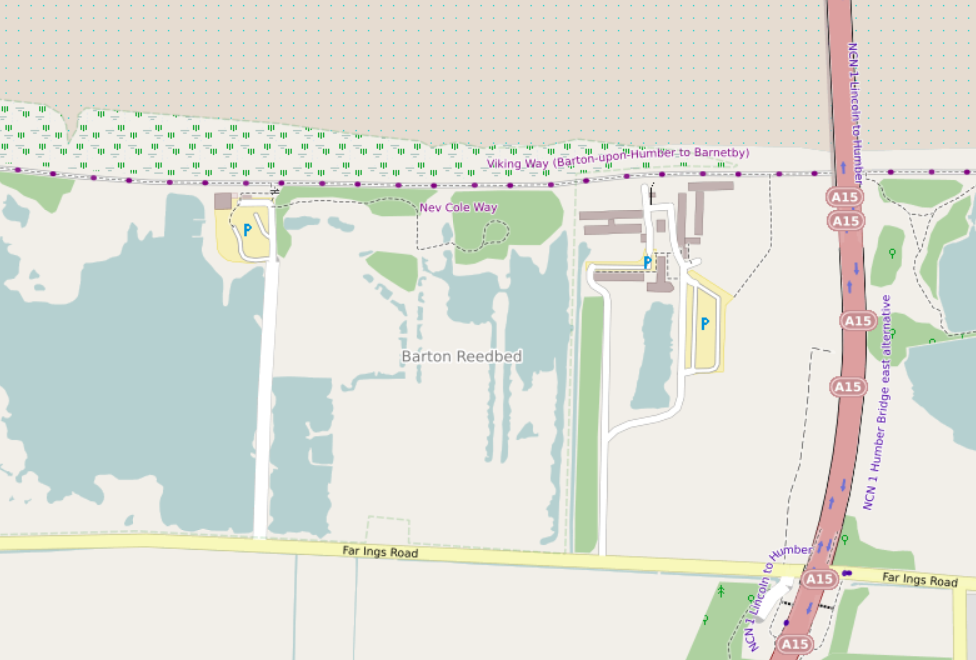
Long route “names” are a challenge in OpenStreetMap. I’ve used various methods to try and suppress these, but it’s not always successful. In the screenshot above you can see this part of the Viking Way which aparently is named “Viking Way (Barton-upon-Humber to Barnetby)”, and this cycle route called “NCN 1 Humber Bridge east alternative”. Thankfully, some examples can be special cased:
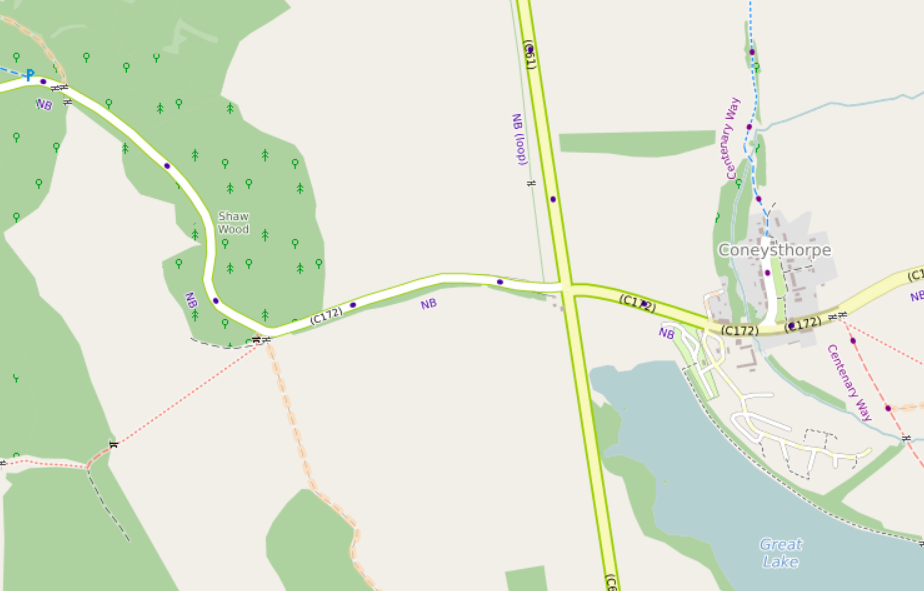
Here the main National Byway and one of the loops have been detected and display using just “NB” and “NB (loop)”, which is essentially what appears on the signs - the signs do not say (in this example) “Malton Loop”.
I’ve also tried to distinguish national and regional routes:
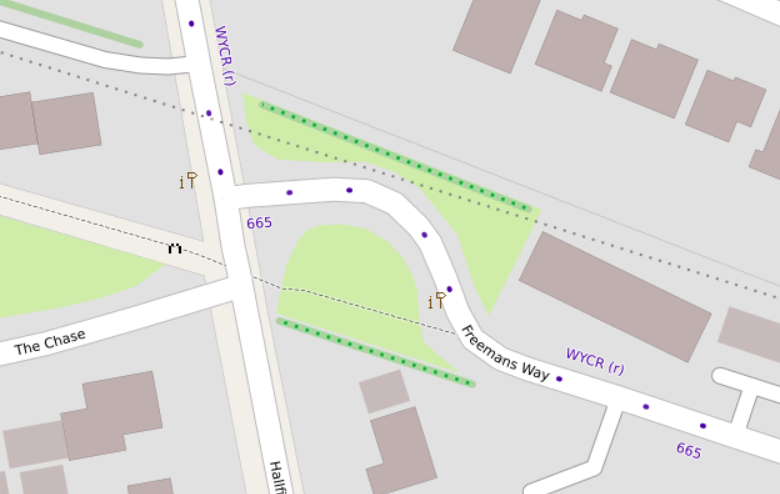
Here the National Cycle Network route 665 and the regional West Yorkshire Cycle Route can be seen - the regional route has an “r” appended to the name. Options for other distinguishing features are limited - colour is used to tell the difference between foot, horse and cycle routes already.
Lots more historical icons
The historic key is an absolute goldmine, if you sidestep the “unhelpful” keys (such as “yes”). These maps are created for Britain and Ireland, so I’ve concentrated on getting values used in Britain and Ireland shown. This has been a bit of a challenge - objects under this key include palaeontological sites like this, archaeological and historic sites from many periods, many different archaeological site types. Many are fortifications, of many different types. Many ancient sites cross over between uses (for just a taster of some of the issues, see here), so deciding how to show them can be a bit of a “choose your own adventure”.
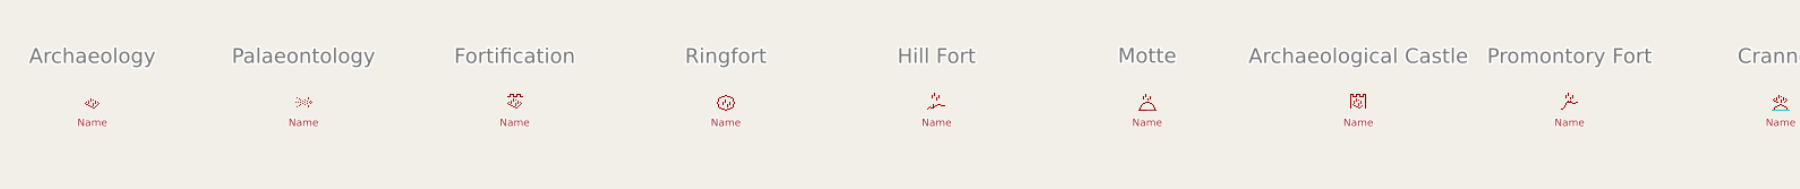
What I’ve ended up with can be seen here. There are about 50 currently - scroll to the right to see them all!
Archaeological features incorporate four vertical posts in the icon, along with (say) a ring for a ringfort and a hill for a hillfort. Ringforts can be tagged in at least four different ways and hillforts five (that I’ve found so far), so deciding what goes in what bucket is a challenge. Other features also try and use variations on a theme (on a “standard tower”, on a building, on a church, or on a stone).
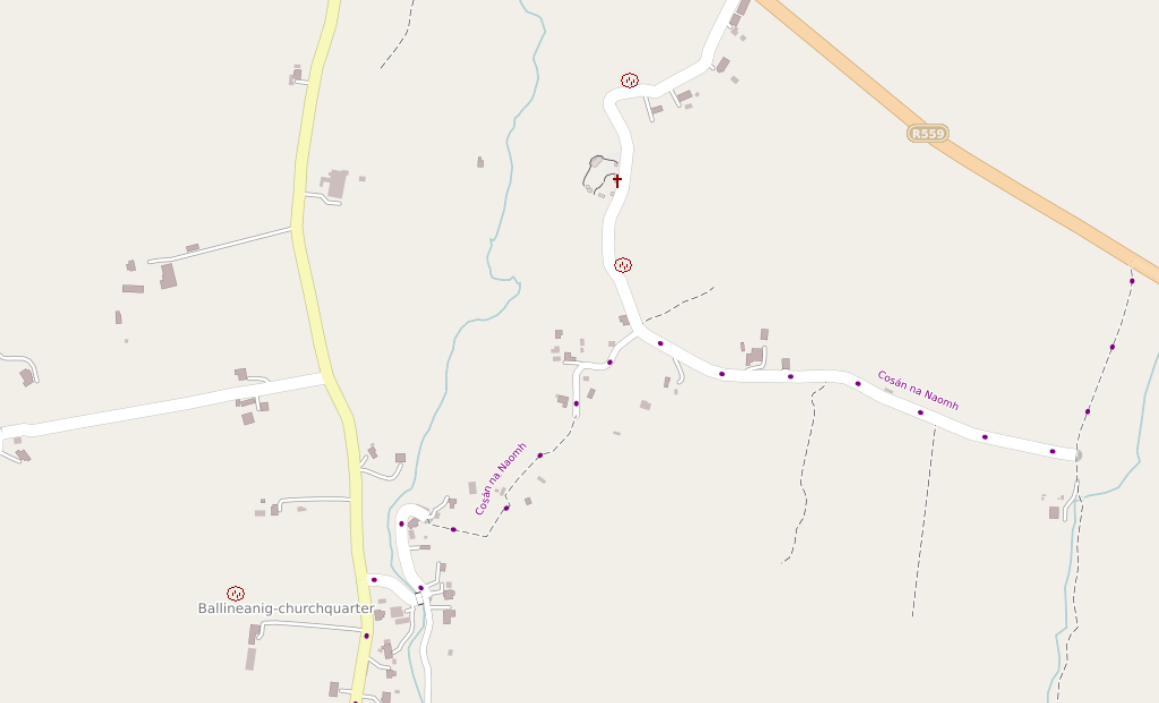
Hopefully the result fits in well with the rest of the landscape:
Discussion
Comment from imagico on 29 December 2023 at 14:41
I am often wondering about your reasoning for the tag interpretation you use. For example you are now endorsing the tag combination
natural=sand+wetland=tidalflat- see for example https://www.openstreetmap.org/way/249534182 - which has 22 uses world wide, with a rendering distinct from bothnatural=sandandnatural=wetland+wetland=tidalflatwhile you do not support in a similar fashion the substantially more widespread (but of course equally semantically weird and quite definitely non-consensus) combinationsnatural=grassland+wetland=wet_meadow(68 uses world wide) andnatural=grassland+wetland=marsh(69 uses world wide).Another note on your drawing of rivers in “the actual width of a small river” at high zoom levels: Be aware that even within the limits of the UK (~50-60 degrees latitude) the drawing width you use at z20 varies between about 3.35m and 4.31m. This is relatively easy to avoid by calculating the scale factor within SQL and using that to determine the drawing width. A generic way to do this can be found in
https://github.com/imagico/osm-carto-alternative-colors/blob/master/sql/map_functions.sql#L40
If you are fine with being limited to mercator projection maps you can of course also do this analytically (which is much simpler and also likely faster).
Comment from SomeoneElse on 29 December 2023 at 15:41
Re calculating the scale factor in SQL - I’ll have a look, thanks!
Re “non-
natural=wetlandwetland, I’ve only had a look at coastal combinations so far, not the more generic query. Fortidalflatthat’swetland,saltmarsh,mud,beach,bare_rock,sand; forwet_meadowthat’s currentlywetlandonly. Usage without the “main” key happens with some other keys too, such asinformation,ruinsand others.There’s also potentially more to be done in splitting wetland types up. I process a lot as “normal” wetland:
and some of those might benefit from a slightly different rendering.
Comment from imagico on 29 December 2023 at 18:49
Still trying to understand your overall tag interpretation reasoning: It seems to me that your aim is ultimately to interpret all combinations of tags as what they most likely are meant to indicate within the classification model of your style, independent of how rare they are and how much more common a different tag combination is to indicate the same thing. That is surely a valid approach to map rendering. It, however, to me seems (a) difficult to understand for the map user, because the meaning of a certain design (like the pattern for
natural=sand+wetland=tidalflat) is not documented anywhere and the aggregation of very different tag combinations into a common design is not always intuitive and (b) pretty hopeless to maintain, because the number of two tag combinations (and even more if you also interpret three tags together - which you do in some cases i think) with at least 22 occurrences in the database is quite exorbitant.Regarding your numbers and interpretations - i assume these are for your map coverage area (UK and Ireland). Globally
wetland=swampandwetland=mangrovehave a much higher significance (in numbers, but especially also in area covered).wetland=tidalflatmight mostly be mud in the UK - but globally it is not. As i explained recentlynatural=wetland+wetland=tidalflatis by most mappers considered predominantly a geomorphological classification.Your interpretation of different wetland tags also does not seem to fully be as indicated. Example: https://www.openstreetmap.org/relation/5320809 - the tag combination in question,
wetland=saltmarsh+surface=mudhas world wide 48 occurrences.Comment from SomeoneElse on 30 December 2023 at 12:53
The map legend doesn’t currently show area colours at all - that’s something I’ve been wanting to add for a while. In this case (see here - actually relatively few of that combination) the two yellow colours mean sand and beach, and blue dots mean “tidal”, as opposed to black meaning “non-tidal”. I’m familiar with the ones off Portmeirion, and that representation seems reasonable there.
That’s a bug - relation 5320809 is in my database as “landuse nil, natural=mud, surface=mud”, which is wrong. It’s a similar bug to this one. When tags are set to conflicting things, you need to decide which should take precedence. Another example is here - should that show as an operational windmill (black) or a historic one (red)? Also see here for similar examples.