I am currently on a visit to Ireland 🇮🇪 and a lack of proper office space makes it difficult to stay productive. I will try to prepare something cool to show off this week. Sorry for keeping you waiting!
🍟
I am currently on a visit to Ireland 🇮🇪 and a lack of proper office space makes it difficult to stay productive. I will try to prepare something cool to show off this week. Sorry for keeping you waiting!
🍟
Why is OpenStreetMap iD not updated like OpenStreetMap ArcGIS? These are two different datasets that need to be linked/updated! Is ArcGIS taking over for OpenStreetMap and requiring a fee? ArcGIS needs to update OpenStreetMap iD if they participate! OpenStreetMap ArcGIS has not updated dataset in months! Please help with coordinating these two data set updates! Otherwise this in-browser edition will soon be obsolete!
In this post, I will try to explain my process how to get best out of Insta360 ONE RS 1-inch camera and successfully upload images to Mapillary. It started out of my frustration of dealing with this camera and Mapillary and I hope you will not have to go through what I have been🙂. I will be focusing here more on software side (how to deal with data) rather than on hardware side (how to set up rig for image capture).
Let me first start with disclaimer that this is not easiest camera to work with Mapillary (hence this guide) and that not even Mapillary is recommending it. It definitively captures better images than GoPro 360, but everything with GoPro is more smooth over whole process, so be aware of this. Camera needs to record in video mode and it relies on additional GPS dongle you have to buy.
This guide assumes familiarity with Python and Linux. Most steps are optional, and you can treat everything as pure recommendation, and while you can always ping me to help you, beware that some technical knowledge (and determination🙂) is needed if you want to extract highest quality from this camera.
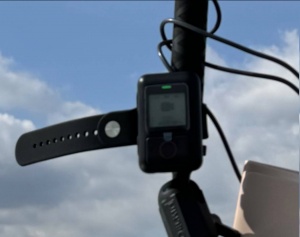
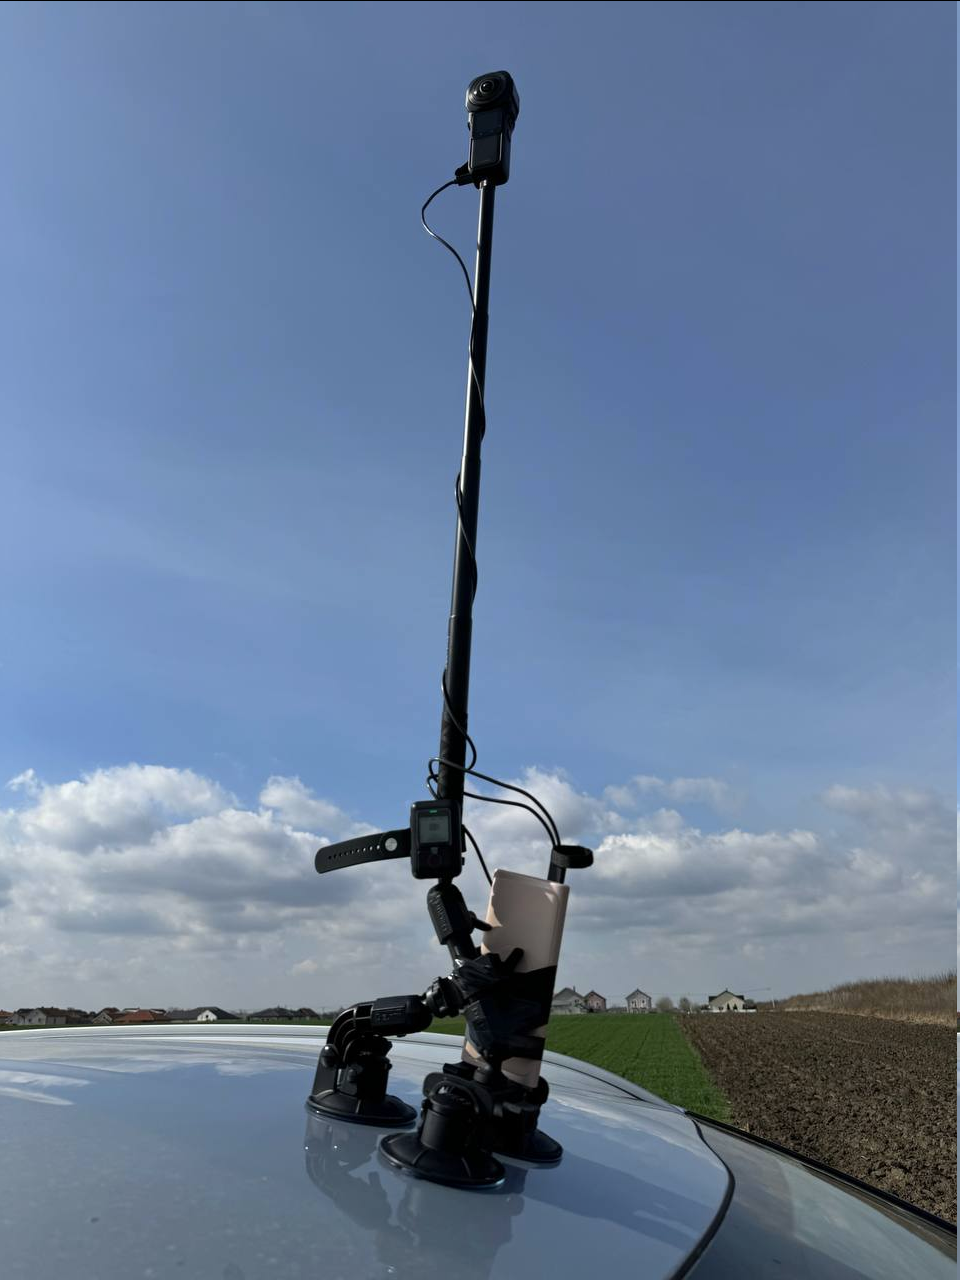
First, you will need another hardware - “GPS Action Remote” with this. In theory, you don’t need it, as you can record with phone (or some other device), but in practice - you just turn on this remote and it works. With phone, you need to have Insta app turned on all the time, worry about display, whether app will get killed by battery optimizations, GPS reception inside car…. I decided to keep my sanity and use this little gadget. It will record GPS (poorly). Connect them and pair them and you can control camera through this remote. Once it show green, it means it is connected to camera and it acquired GPS signal.
Mapillary is suggesting to capture images in timelapse mode. If you do this, you will not get any GPS data (that is - you will get first coordinate and that lat/long will be on all images, so unusable). With this camera, you have to record in video mode. This will result in larger files, more drained battery and prolonged post-processing, but hey - at least it will work. You can expect 1h 10 min of recording if you fully top up battery.
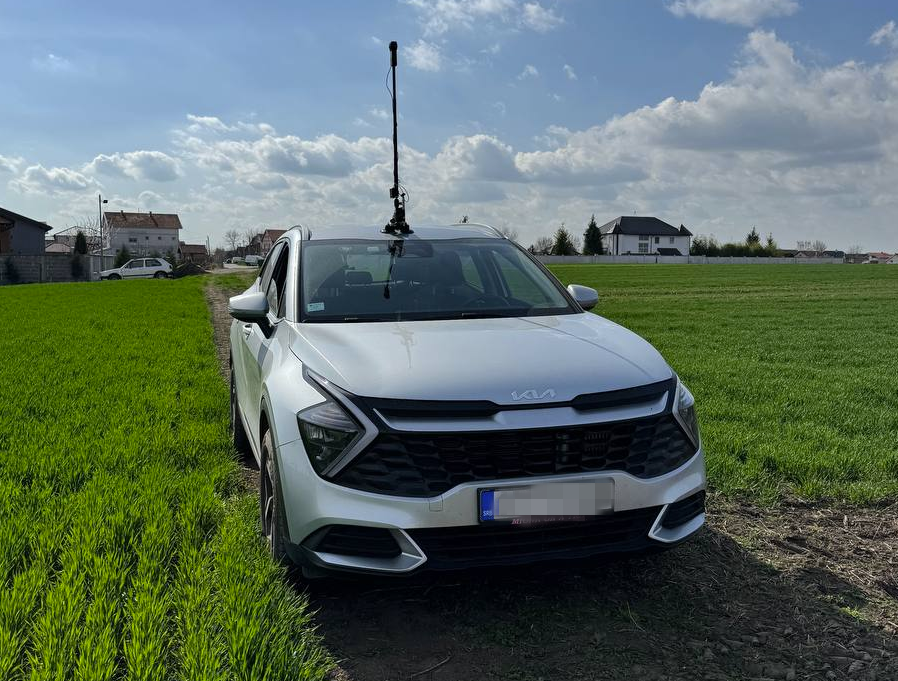
If you are using it outside of car, you can strap both GPS remote and additional battery altogether (watch for hot days and direct exposure of battery to the sun!), but I recommend to go out every 10-20 minutes and check if tripod is holding good. If you are like me and you want to be anonymous and don’t like to be captured by camera, every time you go out, do stop and start video recording again. If you just have one large video, it will be harder to remove yourself (but not impossible), so consider doing this. If you don’t care if your head is in video, then no need for this. This is example how our setup looked like:
If you do not want to do video splitting, you will have to keep your video under 7-8 minutes! If you go over this time, you will have to cut them in post-processing as Mapillary cannot ingest video larger than 8 minutes.
Once you go home, you will end up with .insv files. Download and open Insta360 Studio application. Import this .insv file. You can adjust quality of image if you want. I usually cut beginning and end of video to only parts where I am driving. If I went outside of car and were checking tripod, I also cut those parts (you cannot cut parts of video, but you can export same video multiple times with different start/end cut times). Once satisfied with cutting, export video. Important thing here is to check “Export GPX track”.
If you don’t want to deal with Linux and cutting video/gpx later, this is your time to cut video into 5-6 minutes segments. Anything larger than this increases probability that Mapillary processing will fail (anything above 8 minutes is impossible to be processed).
At the end of the process, you should end with one .mp4 video file and one .gpx track file. Let’s call them input.mp4 and input.gpx.
GPX that is recorded with this “Action Remote” dongle is crime against all scientist, engineers, mechanics and everyone who worked hard to give us ability to know where we are using GPS. For this part, you will need to run Python program. If you can live with poor GPS, no need to fix anything, but I just couldn’t. Here is how it looks before (turquoise color) and after (blue color) processing:
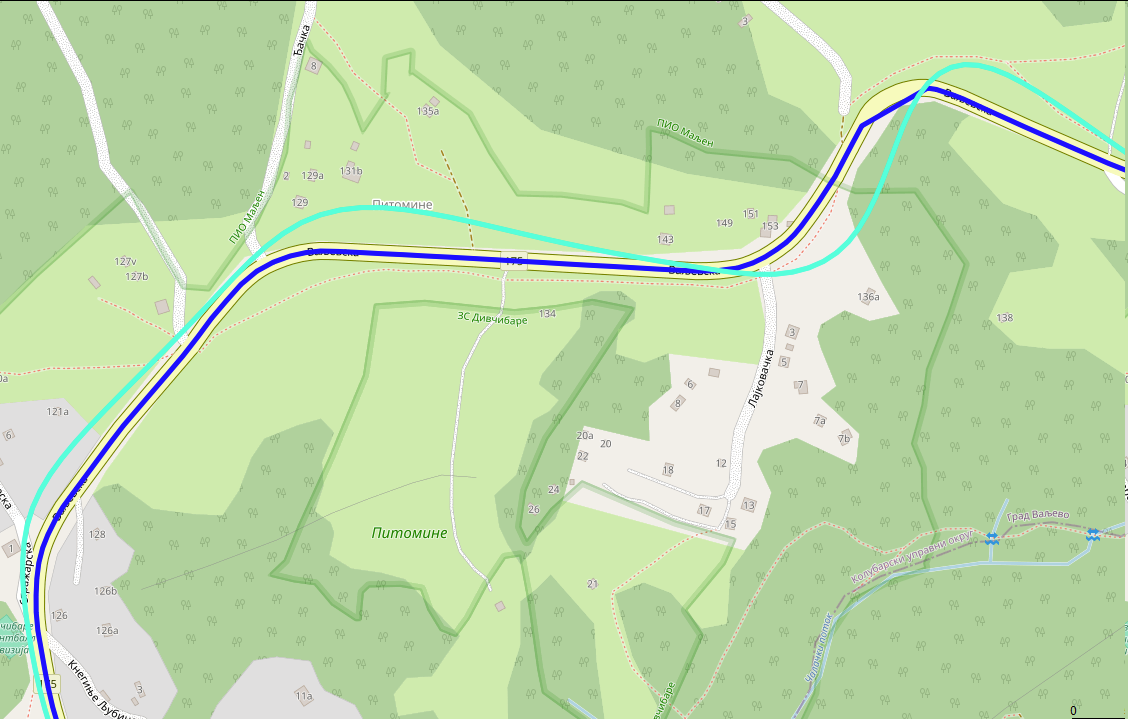
What I did is I used Geoapify platform to do map matching of GPX for me. This is process where you snap GPX trace to closest road. It is really hard problem and I found that Geoapify do very good job converting this Insta360 mess of GPX and their free pricing is more than enough (not affiliated with them, just found them good and easy to work with). First go to their website, sign in and obtain API key (click “New Project”, type any name and on next dialog, just remember generated API key). Here is simple Python script that will take your input.gpx, send it to Geoapify for map matching and then update original .gpx to have new points (while keeping all other attributes like time the same):
import xml.etree.ElementTree as ET
import json
import requests

ET.register_namespace('', 'http://www.topografix.com/GPX/1/1')
ns = {'': 'http://www.topografix.com/GPX/1/1'}

def gpx_to_json(input_filename):
    converted_gpx = {'mode': 'drive', 'waypoints': []}
    tree = ET.parse(input_filename)
    root = tree.getroot()
    trksegs = root.findall('.//trkseg', ns)[0]
    for trkseg in trksegs:
        converted_gpx['waypoints'].append({
            'timestamp': trkseg.find('time', ns).text,
            'location': [float(trkseg.attrib['lon']), float(trkseg.attrib['lat'])]
        })
    return converted_gpx

def do_mapmatching(input_json):
    url = "https://api.geoapify.com/v1/mapmatching?apiKey=<YOUR_APIKEY>"
    headers = {"Content-Type": "application/json"}
    resp = requests.post(url, headers=headers, data=json.dumps(input_json))
    if resp.status_code != 200:
        raise resp
    return resp.json()

def adopt_gpx(input_gpx_filename, mapmatched_json, output_gpx_filename):
    # Load original GPX and segments
    tree = ET.parse(input_gpx_filename)
    root = tree.getroot()
    trksegs = root.findall('.//trkseg', ns)[0]

    # Load mapmatched segments
    waypoints = mapmatched_json['features'][0]['properties']['waypoints']

    assert len(waypoints) == len(trksegs)

    # Change location in original gpx and save it
    for waypoint, trkseg, i in zip(waypoints, trksegs, range(len(waypoints))):
        assert i == waypoint['original_index']
        trkseg.attrib['lon'] = str(waypoint['location'][0])
        trkseg.attrib['lat'] = str(waypoint['location'][1])
    tree.write(output_gpx_filename, default_namespace="")

if __name__ == '__main__':
    input_gpx_filename = 'input.gpx'
    input_gpx_as_json = gpx_to_json(input_gpx_filename)
    mapmatched_json = do_mapmatching(input_gpx_as_json)
    adopt_gpx(input_gpx_filename, mapmatched_json, 'output.gpx')
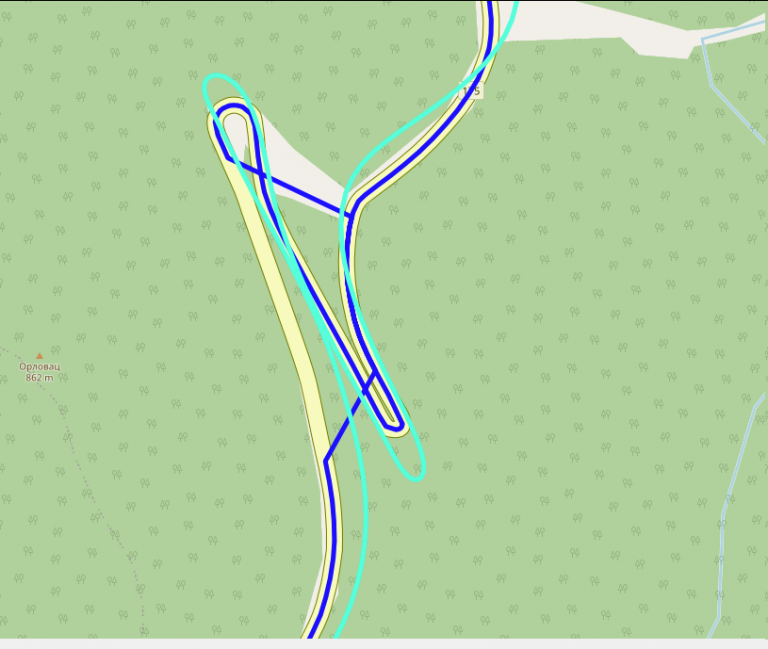
Save this code as “mapmatching.py”, change “YOUR_APIKEY” to value obtained from Geoapify, run it with python3 mapmatching.py with input.gpx in same directory. At the end of it, you should get output.gpx. Open this file in GPX editor of your choice and manually inspect it. Move any bogus points (it can happen, especially with hairpin roads) and save it - you can now use this .gpx instead of old one. I am using GpsPrune software (available for Linux too) to move points. Here is (rare) example where mapmatching can go wrong:
If you ended with videos larges than 8 minutes, this is your time to cut them. I am using ffmpeg and exiftool command from Linux. This is command that will take input.mp4 and split it into out000.mp4, out001.mp4 … files, each up to 5 minutes in length. After that, I am using exiftool to bring back metadata from original video (just so it is nicer to play it in 360 mode in VLC, but I think it is not required for Mapillary):
ffmpeg -i input.mp4 -c copy -strict experimental -map 0:0 -segment_time 00:05:00 -f segment -reset_timestamps 1 out%03d.mp4
exiftool -api LargeFileSupport=1 -tagsFromFile input.mp4 -all:all out000.mp4 # repeat for other out*.mp4 files
Unfortunately, you will have to split .gpx manually (I could create Python script for this too if someone wants, but it was easier for me to just split it in text editor). That is - open .gpx in any text editor, observe time of first point, add 5 minutes to that value and remove all points that happened after exactly fifth minute. If you do this correctly and if you had video of 14 minutes and you cut it in 6 minute segments, you should end up with 3 video - 6 minutes, 6 minutes and 2 minutes as well as 3 .gpx traces - 6 minutes, another one with middle 6 minutes and another one with final 2 minutes. Do rename .mp4 and .gpx to have same names!
You are now ready to upload all these video using Mapillary Desktop Uploader. As long as names of .mp4 and .gpx are the same, you can just drag .mp4 file into Desktop Uploader app and it will show you trace and it will let you upload to Mapillary.
In general, you don’t need this step. This is step if you want to convert video to bunch of images. Some of the reason you might want images:
In these cases, you can try to generate bunch of images from your videos and upload these. For this, mapillary_tools can help you, but it is not easy to get proper arguments. What I found that works for me is this set of options:
mkdir tmp/
mapillary_tools video_process ./out000.mp4 ./tmp/ --geotag_source "gpx" --geotag_source_path ./out000.gpx --video_sample_distance -1 --video_sample_interval 1 --interpolation_use_gpx_start_time --overwrite_all_EXIF_tags --interpolate_directions
I hope this guide could help you with this camera, if you plan to use it for street view. Feel free to ping me if you need help in any of these steps or if you find that something is missing, or that Mapillary made some things easier in the meantime! Big thanks to friends BrackoNe and borovac who borrowed me this camera and who took these pictures (and whose car this is🙂).
We created a F-Droid repository for all Agroecology Map applications.
F-Droid is an open source app store and software repository for Android.
Agroecology Map is a Free Software, based on OpenStreetMap, citizen science platform that aims to assist in mapping and exchanging experiences in Agroecology.
Step-by-step https://youtube.com/shorts/4Cw3jPzmS2I?si=zYxrgR1fHMfHEDq7
(work in progress; screenshots and visuals coming soon!)
Pipelines are notoriously tough to map. They lie mostly underground, often with little to no visible trace on aerial imagery. What may look like a pipeline route on the ground may actually be a tangled bundle of pipelines, and even if we can figure out an individual pipeline’s true route, imagery tells us nothing about its name, who operates it, or what substance it carries.
Fortunately, the Pipeline and Hazardous Materials Safety Administration (PHMSA), an agency of the U.S. Department of Transportation, publishes authoritative, open data on pipeline routes. The Public Viewer, however, presents this data as raster images and limits how far you can zoom in. Despite this, we can use it quite effectively to identify pipelines and trace their precise routes.
Requirements: JOSM, with Expert Mode enabled.
There are over 3,000 county-equivalents in the United States. You may want to start with a place you’re familiar with, an unreviewed pipeline found on TIGERMap, or an area where you suspect data is missing from Open Infrastructure Map. Regardless, we’ll be focusing on mapping one county (or parish, borough, independent city, etc.) at a time.
In JOSM, open the Download window (Ctrl+Shift+Down). Choose the “Download from Overpass API” tab along the top (if this is missing, open the Preferences window, make sure the “Expert Mode” box in the bottom left is checked, and try again). Paste the following into the query field:
{{geocodeArea:"Loving County, Texas"}};
way(area)[man_made=pipeline];
(._; >; <;);
out meta;
Replace Loving County, Texas with the county-equivalent of your choice, and hit Download. Don’t worry about selecting a bounding box on the map; it will be ignored.
Now that you have a canvas to work with, you’re ready to get started mapping.
Open the Public Viewer and enter your state and county. You’ll find two layers enabled by default: Gas Transmission Pipelines and Hazardous Liquid Pipelines.
Right-click on a pipeline and select a layer in the Identify menu. The pipeline becomes highlighted in yellow, and a box pops up with details about the pipeline, including name, operator and commodity (see substance=*).
If your county has only a few pipelines, then this should be enough to work with. But if you encounter several pipelines tangled together, queries can help sort them out.
Click on Query Tools, then Query Pipelines. Pipelines can be queried based on various attributes, such as OPID (operator) or commodity. But for this exercise, we’ll be doing a spatial query. Near the bottom of the window, choose Draw an Area, and click the following button.
Find a cluster of pipelines, and click on the map to add corners of a polygon surrounding the bundle. Double-click to add your last point and finish.
Check the box for “Also display attributes in a table”, and hit OK. A new layer will appear on the map containing only the pipelines passing through the selected polygon, and a box will pop up with the details of each pipeline.
Select a row in the table, and then click the Highlight Selected Feature button below. The pipeline will show up yellow on the map.
fixme=continue to the node at the end.English below / Português abaixo
Dans mon précédent post, mon propos visait à promouvoir la cartographie de terrain comme première activité concrète de cartographie OSM proposée à des débutants, plutôt que l’hégémonique cartographie des bâtiments, mais pas du tout à dénigrer la cartographie des bâtiments en tant que telle : alors que certaines personnes dans la communauté voient essentiellement OSM comme une base de données de navigation et jugent les bâtiments comme un objet secondaire voire assez inutile, pour ma part, je reconnais tout à fait leur importance pour divers aspects, comme par exemple, participer à représenter (notamment avec les barrières et les arbres) ce qu’on appelle en géographie le tissu urbain, ou servir comme approximation de l’effectif d’une population. J’ai d’ailleurs enseigné pendant quelques années InaSAFE pour QGIS, qui utilise notamment les bâtiments OSM comme données de vulnérabilités, ou coordonné la cartographie de tous les bâtiments dans les préfectures et sous-préfectures de la RCA pendant la crise de 2012 -2014.
Pour autant, je ne fais pas des bâtiments l’alpha et l’oméga de la carto OSM, et en fait, surtout pas l’alpha. En effet, ce n’est pas le premier objet que je ferais cartographier sur imagerie par des débutants :
Je conseille plutôt de faire commencer les débutants par la cartographie des routes :
In my previous diary post, my aim was to promote terrain mapping as the first concrete OSM mapping activity offered to beginners, rather than the hegemonic mapping of buildings, but not at all to denigrate the mapping of buildings as such: While some people in the community see OSM essentially as a navigation database and consider buildings to be a secondary or even fairly useless object, for my part, I fully recognise their importance for various aspects, such as helping to represent (particularly with fences and trees) what in geography is known as the urban fabric, or serving as an approximation of the size of a population. I also taught for a few years InaSAFE for QGIS, which uses OSM buildings as vulnerability data, or coordinated the mapping of all the buildings in the prefectures and sub-prefectures of the CAR during the 2012-2014 crisis.
However, I’m not making buildings the alpha and omega of OSM mapping, and in fact, especially not the alpha. In fact, it’s not the first object that I’d have mapped on imagery by beginners:
I recommend that beginners start with hisghway mapping (roads, streets, paths…):
Translated with DeepL.com (free version)
No meu post anterior, o meu objetivo era promover o mapeamento do terreno como a primeira atividade concreta de mapeamento OSM oferecida aos principiantes, em vez do hegemónico mapeamento de edifícios, mas não pretendia de todo denegrir o mapeamento de edifícios enquanto tal: Enquanto algumas pessoas na comunidade vêem o OSM essencialmente como uma base de dados de navegação e consideram os edifícios como um objeto secundário ou mesmo bastante inútil, pela minha parte, reconheço plenamente a sua importância em vários aspectos, tais como ajudar a representar (particularmente com vedações e árvores) o que em geografia é conhecido como tecido urbano, ou servir como uma aproximação da dimensão de uma população. Também ensinei durante alguns anos o InaSAFE para o QGIS, que utiliza os edifícios do OSM como dados de vulnerabilidade, ou coordenei a cartografia de todos os edifícios das prefeituras e subprefeituras da RCA durante a crise de 2012-2014.
Por tudo isso, não estou a fazer dos edifícios o alfa e o ómega do mapeamento OSM e, na verdade, especialmente não o alfa. De facto, não é o primeiro objeto que eu mandaria mapear em imagens por principiantes:
Recomendo que os principiantes comecem pela cartografia rodoviária (estradas ou ruas):
Traduzido com DeepL.com (versão gratuita)
| It’s summer in the Philippines, and even at 08h, the sun’s already ablaze, and a friend with an umbrella is always welcome sight. |
Our Tuesday morning in Tagbilaran started with a field mapping exercise with volunteers from the University of Bohol YouthMappers Club, gathering by the bandstand in Plaza Rizal for last minute rejoinders.
And so we got ready to head out to our assigned areas, to write down observations, sketching on FieldPapers, for fresh geodata we could use to update the neighborhood map. It’s also a practical exercise for the Geodetic Engineering students who participated, but not before a group photo, while everyone is still fresh-looking.
We also collected street-level imagery, which we also plan to use for a workshop. Panoramax , of course, was used for the initial batch of photos, because we want to use them immediately, a workshop right after the field work, but we plan to upload the collected images on Mapillary, as well.
We’ve had no issues using OpenCamera for capturing imagey , since almost everyone was using Android. We’d have recommended SkyFlow for iOS, but the outlier was a device with HarmonyOS, which uses “PetalMaps”, apparently a map service from Tomtom, but doesn’t appear to use any OSM data, nor Google Maps.
After a 90-minute dose of sunshine, we trotted back to the campus for the MapaTime workshop, a respite from the heat and then some hands-on mapping.
Each of the volunteers assigned to an area is given a theme to focus on, though they’re free to collect and take note of anything they find interesting:
The heat map below visually summarizes the editing efforts made by local community of mappers in Tagbilaran, hosted by the University of Bohol YouthMappers club.
Their club is planning to run an initiative to improve the neighborhood map around their campus soon, and hope that the tools and techniques they picked-up from the workshop can be applied for that project.
Finally, a last group-fie with their college dean, and their “UB pose” – a perfect way to hide my double-chin! 😆
Welcome to my fifth OpenStreetMap NextGen development diary.
This week has been mostly focused on GPS Traces 🛰.
🔖 You can read my other development diaries here:
https://www.openstreetmap.org/user/NorthCrab/diary/
🐙 This project is open-source and publicly available:
https://github.com/Zaczero/openstreetmap-ng
It’s best to experience the refreshed traces in a video form, so I prepared a short demo (no audio):
⏯️ https://files.monicz.dev/osm/traces-demo.mp4
For comparison, here’s how the same trace looks on the current website:
https://www.openstreetmap.org/user/bielebog/traces/11326871
You will quickly notice the super-fast upload speed and the new trace animations. If there’s something wrong with the file you attached, you will receive instant feedback on the upload page. One new feature is possibility to edit trace name. Previously, this feature has been hidden behind API 0.6.
One more planned feature is rendering the map behind the trace animation. Now that the system works on individual coordinates, it will be fairly easy to implement. Traces without a human-understandable point of reference are not as useful as they could be.
Let’s start with discussing the current URL routes.
/way/<ID>/note/<ID>/user/<USER>/traces/<ID>Which is not consistent. OpenStreetMap-NG unifies this experience by introducing a new URL route: /trace/<ID>. All existing URLs remain backwards compatible and are automatically redirected.
There’s just a few things left before reaching the core feature parity with the existing website. Those are the things I want to finish before inviting new contributors ツ.
Last week I hinted towards the announcement of a contributor benefit. Today, I will talk shortly on 1 of 2 currently planned ideas, that will help the project grow and stay strong.
Firstly, who are the “contributors”? Those are the people who help the OpenStreetMap-NG project. For example: by testing the website, donating, contributing code, helping with localization, graphics and interface design, etc.. The scope is broadly defined, as people can contribute in many different ways!
Contributors joining before the project is officially accepted as the main OpenStreetMap website, will be able to become a member of the NextGen Founders invite-only community and receive a small badge on their user profiles. This feature is a part of the original announcement (under the name “Community Profiles”).
This is a time-limited benefit, that provides a unique thank-you to all people that help (and will help) making this project a reality. The 2nd benefit will be announced in some time in the future.
Here’s my weekly appreciation to the current project patrons. Thank you for believing and helping me do what I love :-)
Currently, the project is sponsored by 11 people!
Five private and three public donors on Liberapay, and three public on GitHub Sponsors.
If you can, please consider supporting the NG development:

This project is not affiliated with the OpenStreetMap Foundation.
Having both GoPro Hero11 and Max360, I was curious whether there would be any use from running both cameras at the same time. While Max 360 captures all around, would Hero 11 possibly have better resolution, which could be useful for streetview platforms like Mapillary and Panoramax, thus also providing additional detail for OSM mapping?
Here’s the same object - a surveillance camera - from both action cameras. Hero11 is even a little bit further away.
Max360:
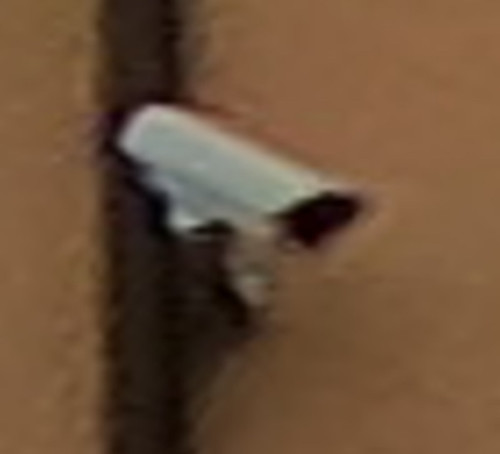
Hero11:

As can be seen, Hero11 does offer notably better resolution, which could be crucial with signs and other objects - thus it does make sense to collect imagery with two cameras like that at the same time.
My first diary entry in thirteen years, and so much has changed on OSM. The editing tools have come on so much, and there is now an incredible level of detail, even in the rural town I’m living in now. I think I need to go back to the documentation to refresh my memory and look at adding all the things missing in my neighbourhood.
It is for doing mapping so I can get better, so thank you guys! Google Maps is my main option but I am in Rank 149 of OpenStreetMap! Thank you for @DavidDean as he said he was in the top 50 in 2008! I specifically like you guys! Kind Regards, Brilloant
On April 3, 2024, an earthquake happened outside the coast of Hualien, which caused serious roadblocks and human casualties. OpenStreetMap Taiwan has opened 3 projects for mapping affected areas, requesting worldwide mappers to map buildings, landuses, missing roads or waterways in Hualien.
We are talking if there is a possibility to donate the newest satellite image after the earthquake to map the after-earthquake situations. And the possibility of hosting mapping events on-site after the affected area returns to normal, helping locals by mapping the newest map data.
That’s the name of the workshops I facilitated last week, with the goal of introducing/promoting OpenStreetMap, along with introducing tools like FieldPaper, OpenAerialMap, Sketch-Map Tool and Umap, to meet the objectives of local DRR practitioners’ upcoming mapping initiative.
Last Friday I had conducted two workshop in Iloilo, one (unplanned) for Iloilo’s Provincial DRRMO (disaster agency), and another for Iloilo City own DRRMO. In the Philippines, city charters may provide them autonomy from the geographic province they’re part of. These Disaster Risk Reduction Management Offices (a tongue-full, I know) are the government agencies responsible for mitigating localized disaster risks, and planning for disaster prevention for their respective territories.
Last year, in a random visit in Iloilo, I met some folks from the City DRRMO team and since then, I found out that they’ve capturing community-based hazard risks and perceptions using FieldPapers. Unfortunately, FieldPapers uptime wasn’t as reliable as before, and eventually the built-in Bing imagery became unavailable, too.
I’ve kept in touch with the City’s DRRMO team, and when I told them of a planned (gustatory) visit, they asked if I could run another training workshop for them. The small workshop was planned for a dozen people, but the day before the workshop I was surprised to learn than they confirmed 28 participants, and couldn’t even accommodate my own guests.
Well, that’s how I ended up with two separate workshops, discussing the same topic, but interestingly, the engagement was different with one group being more technical, and familiar with geodata/GIS/maps, and the other are more focused on being able to collect local spatial knowledge.
Anyway, with the feedback about issues they’ve been encountering with FieldPapers, I ran into the updated Sketch-Map Tool which now has built-in ESRI Aerial Imagery included.
One of the earliest Pen & Paper tools I’ve learned to like, especially when working with folks averse to “tech”. It’s cheap, and it (used to be quite) reliable.
Creating maps could be tedious, manually requiring people to manually define their area of interest. I think it’s been years since the search function last worked properly.
The participant’s favorite feature is FP’s ability to use external TMS endpoints, and in our case, I demonstrated how OpenAerialMap imagery taken from drones can be used to deploy fresh maps that can be used as background of maps they wish to deploy on the ground.
They participants also like how FP serves TMS tiles of the uploaded snapshot (marked-up) map, which they can use as a background layer on iD (or another editor) for digitizing on OpenStreetMap.
Maximum paper size is ISO A3, which isn’t probably big enough when you expect participants to work together as large groups. That size is more than sufficient for individual mappers though.
If the users aren’t conscious about it, they may inadvertently create atlases with snapshots that may reveal personal or private information, so that’s one thing users should really watch out for.
This recently revamped tool now comes with built-in satellite imagery from ESRI, but you’re limited to that or the Mapnik (OpenStreetMap’s default layer) background for your maps.
The interface for creating maps is more friendly, and the OHSOME map quality report helpful, but it becomes tedious when you need to create separate maps for a large area, which one has to to create one-by-one.
One of the favorite features for SMT is it’s built-in ability to digitize (properly) marked features and create GeoTIFF and GeoJSON files out of the marked-up map. The data is not stored in HEIGIT's servers, so the risk of accidental disclosure of private information is minimized. Update: 2024-04-22 According to mschaub’s comment, the data is actually stored in HeiGIT’s server, but becomes inaccessible after a day:
One small correction I would like to make (or maybe I misunderstood you): We do store the original sketch map and the uploaded sketch map with markings on them on our servers. The first one, we need to be able to do georeferencing of the sketch map after it was uploaded. The second one we store to be able to improve our machine learning models which are responsible for detecting the markings. We do point this out to the users (see text on the upload dialog). But it is not possible, even with the right URL, to download any of those files one day after they were created. So data is stored on our server, but the risk of accidental disclosure of private information is also minimized.
During the role-playing segment, we experienced how quick the process may be like, from map creation, to the mark-up/reporting process, and the automatic digitization, then visualizing the created GeoJSON files quickly, using Umap.
Over-all, everyone found the tools easy-enough to learn, and accessible for their capacity level.
At it is, these two tools are complementary and one could be more useful than the other, depending on the users’ priorities. To wit:
| FieldPapers | Sketch-Map Tool | |
|---|---|---|
| supported layer | Mapnik, HOTOSM, TMS | Mapnik, ESRI Imagery |
| interface | functional, but search doesn’t work | more user-friendly, works as expected |
| registration | optional | none |
| max. paper size | ISO A3 | ISO A1 |
| geodata | GeoTIFF | GeoTIFF, GeoJSON |
| TMS of marked-up map | yes | no |
| multi-map support | yes | tedious |
| privacy risks | moderate | low |
I’m excited by the initiatives being drawn-up by both DRRMOs, though they are still working independent of each other.
The search and rescue team, and the local fire department, were very enthusiastic about using Pen & Paper to help map location of water wells (parts of the city are experiencing drought), while the search and rescue intends to use them for mapping highways attributes (width and access) and missing footways and paths, to improve response times during emergencies.
I see a potential to make more use of OpenStreetMap data in their local communities, encouraging local contributors to keep the map updated and relevant for their own needs, and the participatory approach they are undertaking, in collecting local spatial knowledge and experience, which could lead to improved usability of gained results for local capacity assessments, and the role of the OSM ecosystem of data and tools serving as a bridge into their formal DRR process.
I would’ve loved to see more of the local active mappers participating in the event and planned activities, but unfortunately, we failed to receive any word from the folks we reached out to.
Below is a collage of some photos from the activity.
While commercial map providers like Google, provide map data in local Indian languages, the local language labels are usually transliterated from English, resulting in errors. OSM, Wikidata and Wikipedia platforms provide a way to improve the local language maps leveraging multilingual labels through Wikidata identifiers on OSM, through semi automated updates. For good quality maps on Wikipedia and OSM, the Wikidata location needs to be accurate and Wikidata identifier should be uniquely mapped to the actual OSM geometry. I worked on removing the mismatches for villages of a district in Andhra Pradesh. I have documented my experience as clearly as possible, so that even users with less programming and tools skills can contribute to the work. As an example, identifying and fixing errors in Wikidata location is given below.
 The geodata is presented in Wikidata page and corresponding English Wikipedia article page using OSM as background map. If one notices that the marker is not near to the names identified on OSM map, then there is possibility of an error. Even if the name is identified on OSM background map, selecting different zoom levels allows checking whether the place is in the correct location.
 The correct geolocation is obtained from Open Data compliant StateGIS portal run by Bharatmaps.
 After Wikidata coordinate location is updated with the correct data, Wikidata page and the corresponding English wiki article show the correct map.
Full article covers how to identify more complex errors based on the geographical distance between Wikidata location and OSM node location and also when the Wikidata and OSM geometry that is associated are outside the area of interest. Sample Wikidata Sparql scripts leveraging Sophox interface to OSM, which can be easily edited are provided to help contributors with less programming and tool skills to contribute to these efforts.
For more information, check out Improving geodata accuracy on OSM and Wikidata (Full article on OSM wiki) and let me know your feedback.
![]() As we announced in a previous post, we continue to inform the OpenStreetMap LATAM community about the SOTM LATAM 2024 committees, and now we present the Programming Committee.
As we announced in a previous post, we continue to inform the OpenStreetMap LATAM community about the SOTM LATAM 2024 committees, and now we present the Programming Committee.
The main functions of this committee are:
The committee members are:
| Member | Representation | Position | Role |
|---|---|---|---|
| Anderson Toniazo | OSM Brasil | Member | Organizing Committee |
| Virginia Brussa | OSM Argentina | Member | |
| Olga Paredes | OSM Bolivia | Member | |
| Yasmila Herrera | Yeka Street | Member | |
| Sebastián Bravo | Youthmappers SAGEMA | Member | |
| Mariela Centeno | Youthmappers ESPE | Member | |
| Juan A. Barajas | Youthmappers LATAM | Member | Organizing Committee |
This committee should have its first meeting in the coming days to elect its president and begin carrying out its duties.
Well did that alone
![]() As we announced in the previous post, we continue to inform the OpenStreetMap LATAM community about the SOTM LATAM 2024 committees, and now we present the Academic Program Committee.
As we announced in the previous post, we continue to inform the OpenStreetMap LATAM community about the SOTM LATAM 2024 committees, and now we present the Academic Program Committee.
The main functions of this committee are:
As additional information for those interested in presenting a talk or presentation, the topics may be (but are not limited to):
The committee members are:
| Member | Representation | Position | Role |
|---|---|---|---|
| Rodrigo Smarzaro | UMBRAOSM | Member | Organizing committee |
| Matheus Correia | COIMBRA Univ. | Member | |
| Nathan Damas | Youthmappers UFPR | Member | |
| Kauê de Moraes V. | Youthmappers UFPR | Member | |
| Maya Lovo | Youthmappers | Member | |
| Carolina Garcia | Youthmappers ESPE | Member | |
| Patricia Llanos | SBCS | Member | |
| Sandra Hernandez | Youthmappers Uaemex | Member |
This committee should have its first meeting in the coming days to elect its president and begin carrying out its duties.
So I thought surveys meant that I go out and ask people… conduct a survey, but apparently it means that you have been there personally to check it… so… that means I didn’t tag any of my entries where it would apply with this… lol
Welcome to my fourth OpenStreetMap NextGen development diary.
Sorry for being a day late! I wanted to finish up one of the new features which caused this small delay. ✨
🔖 You can read my other development diaries here:
https://www.openstreetmap.org/user/NorthCrab/diary/
🐙 My work is available publicly on this GitHub repository:
https://github.com/Zaczero/openstreetmap-ng
Let’s summarize the last week’s work:
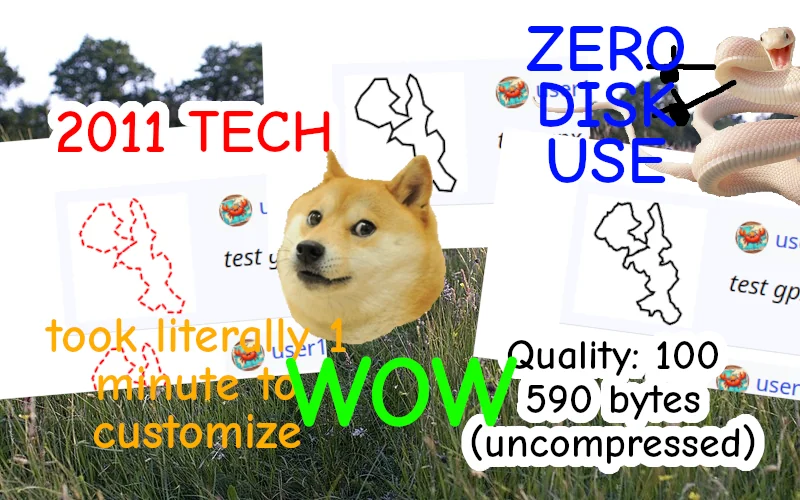
While migrating the traces functionality, I came up with an amazing and seemingly obvious idea. Why not make trace images SVGs and render them client-sided? This feature has few significant advantages: even faster trace uploading, no additional disk usage, unlimited customization, infinite resolution, faster page loading. And so here it is:
The application can freely adjust the quality of generated images. The code can also be reused for implementing proper trace-on-map rendering, which is one of the new upcoming features.
SVG supports animations too!
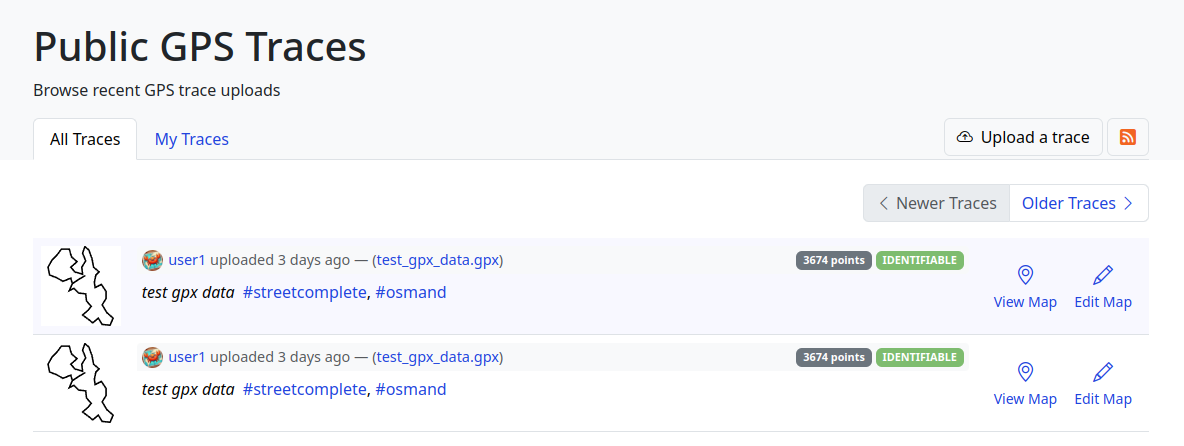
Last week I have also worked on refreshing the traces UI, focusing on making it more open and friendly. If you have been following my previous diaries, you may recognize some of the new style language.
I also wrote and successfully tested server-deployment scripts for the application. They are currently a part of the openaedmap-backend project but will soon be copied over to the openstreetmap-ng. Both projects share many similarities in how they are run.
Previous development diary #3 was packed with lots of new stuff. I took this week a little slower to catch a breath. Meantime, I contributed to other projects (openaedmap, starlette) and also helped OSM-PL with server migration process. I was also away for a short time for some BBQ🌞!
Thank you to this week’s project patrons! I truly appreciate your every contribution!
Currently, the project is sponsored by 11 people!
Five private and three public donors on Liberapay, and three public on GitHub Sponsors.
If you can, please consider supporting the NG development. Any amount helps me focus on making high-quality free software for everyone to enjoy! (shh… next week I will announce a new supporter benefit) 😋
This project is not affiliated with the OpenStreetMap Foundation.

This is the Closing Chapter! However, the story continues😀
My friend (and colleague) Ola messaged me and asked, “Eden, how do you feel, that your internship at HOTOSM is ending soon?” I took a long pause to answer that 🥹.
As the curtains draw close on this chapter of my professional journey, I find myself reflecting on colourful experiences, lessons, and memories that have defined my time as an intern at HOTOSM.
It’s been 3 months already!?🥹 Like someone rightly said “time goes by quickly, when you are having fun”. I’m usually the type of person that looks forward to the end of a thing because I learnt to always finish what I started. But this time, it felt weird! A mix of nostalgia and anticipation.
I love it at HOT and I will forever cherish my time here; where every encounter was a lesson and every challenge a stepping stone. The vision, the community, the staff, the enriching days of inspiring coffee chats, talks with my favourite colleague, the opportunities, the work I did, and my wonderful mentor, Petya Kangalova.
Throughout these past 3 months, I’ve been privileged to be guided by the most amazing mentor ever, Petya Kangalova, who generously shared wisdom, resources, expertise, and opportunities for me to grow. Each day presented a fresh “GO!” for me to experiment, iterate and grow. From navigating the complexities of projects to engaging in insightful conversations on Mondays (and other days). Every moment has contributed to my development as a professional and my confidence as an individual.
I’m proud of myself for the work I did, and the initiatives I took in an attempt to maximise my time with HOT. I got really sweet feedback that will forever keep me motivated. And the story continues, it doesn’t end now. Not anytime soon. I am thankful for the opportunity to be a co-mentor for the next round of Outreachy internship at HOTOSM.
Part of what’s next for me is to continue contributing to HOT’s open source project, with a special interest in HOT’s fAIr software. fAIr is an open AI-assisted mapping service software, that aims to improve the efficiency and accuracy of mapping efforts for humanitarian purposes.
If you’re a beginner to open source and don’t know where to start, but excited to do so, I recommend joining the HOT Tech and Innovation Working Group to learn and grow your skill, within an inclusive community. And If you want to get your hands busy right away, check for “good first issues” or “beginner friendly issues” at the HOT Github page.
You can also watch this comprehensive video guide on how to contribute to HOTOSM open source projects on Github. Listen to our active contributors share their experience contributing to HOT’s open source project.
C’est fini – but it is also a new beginning. With a heart of gratitude and determination, I step forward, eager to embrace the next challenge, and open to the endless possibilities that await beyond the threshold of familiarity.
Special thank you to my mentor, Petya Kangalova. Thank you HOTOSM, Outreachy internship – you have been more than a chapter; you have been a transformational point in my professional journey, guiding me towards the horizon of endless possibilities.
If this is your first time reading my diary, please catch up with my previous blogs here or connect with me and reach out via X @edenxcodes to stay updated on my next steps.
Till next time,
Eden.