OpenStreetMap logo OpenStreetMap

Diary Entries in English

Recent diary entries

Posted by -karlos- on 18 April 2025 in English.

Once I had a concept to render gabled roofs in 3D with OSMgo.org but it did not work. Often the roof looked like broken down. After a long time of abandoning OSMgo, I found a “working” solution and used it in my code. But no, the browser got stuck in an infinite loop %-(

May be update the version of ThreeJS, after years? That took me many many hours. For the geeks: Using es6 needed much export and import. After hours of typing, I fond at last VS-Code plugin to show me the missing variables. Not using “with” any more needed a lot of “this”. Worse, ThreeJS dropped the geometry.merge() and changed the geometry attributes, typing, typing. Hey, something positive!: Because now Vertex-Colours are used, only one Draw-Call per 3D-tile is needed. OSMgo should run faster now.

With the new ThreeJS the infinite loop was gone, but: the roof was at the wrong place and direction. Some adaptions of the theft code were needed. Now, the City of London looked much better than before. Oh wait, all roofs were mirrored, one more adaption.

See full entry

Posted by kumakyoo on 18 April 2025 in English. Last updated on 25 April 2025.

This blog post is part of a series of blog posts about the new OSM file format “OMA”. This is the seventh post. At the end of the article you’ll find links to the other blog entries.


To create and use blocks and slices, you need to know the type of an element - is it a highway, a landuse or a barrier. And if it is a highway, is it a primary, a secondary or a footway.


Keys

Apart from relations where the type key stores it, this information is not available within OSM data. Again, it has to be guessed, and there is much discussion on the forums and elsewhere about the “main keys”, as they are sometimes called. Several apps, such as most OSM editors, contain such a list, but the lists are not always the same.

The approach I took was this: I counted all the keys of all the tags of all the elements and took the one that appeared most often in this list. I considered this the first main key and removed all elements with this key from the set of elements. Then I repeated this process.

After a while some “dirt” remains: elements that do not show a clear “main key”. I think if you start digging around in that dirt, you might find some hidden gems, that is, main keys that aren’t used very often, because the items they represent do not exist very often in the real world. But I didn’t.

I repeated this process twice,1 once for nodes and once for ways. You have to keep an open mind, because sometimes the top key is clearly not a “main key”, for example name pops up after a while. Addresses needed some special treatment, because there is no address key. Addresses are stored as a collection of addr:* keys. Fortunately the addr:housenumber is almost always present, so I used that as the key for addresses.2


Values

See full entry

This post is the result of a student project. The work was done by the following group of students: Alice Rey, Jihene Haj Hamouda, Yahia Heni, Mohammed El Mehdi Alaoui, Kaies Mhadhbi.

Example

Try our online demonstration to find your own shade-optimized route! Discover how we improve pedestrian comfort during hot days by prioritizing shaded paths. (demo restricted to the Nantes Area)

Introduction

This project focuses on enhancing pedestrian routing in OpenStreetMap (OSM) by incorporating shade into route computations. Exposure to direct sunlight significantly affects pedestrian comfort, especially during hot weather, making shaded routes preferable even if slightly longer. Despite this importance, existing OSM data related to shade has typically been qualitative and limited in precision. To address this, we developed and implemented two complementary methods to integrate detailed shading information into OSM-based routing engines like Graphhopper:

See full entry

Simple 3D buildings

They are ofcourse not M4TR as you use the building=yes tag and you add colours, height and roof shapes.

But for more complicated buildings?

What if there is an apartment building with different colours? Am i allowed to use building:part=yes for each colour? Or is that M4TR?

Monuments

Monuments can be a little sad to just se as a square or even a node, so could i map them in 3D? That sure is M4TR, but we want to map how it is in reality. So therefore it should be allowed? Right?

Posted by daniel-j-h on 17 April 2025 in English. Last updated on 29 April 2025.

How an algorithm from the 80s sets the new standard for modern spatial indices

Geospatial indices are all around us. They allow us to search through millions of points in an instant answering questions such as “find me the closest bike repair shop” efficiently.

And yet there are still forgotten gems in the archives of computational geometry: Space-filling curve based spatial indices. With an optimization going back to the year 1981 this spatial index delivers surprising efficiency; and yet it is rarely discussed in the geospatial community.

Let’s go back in time and rediscover how we can build a spatial index on top of a space-filling curve to accelerate geospatial queries and simplify geospatial indexing for location-based applications.

Note: If you know about Z-Order Curves or Hilbert Curves already I still recommend you reading this as the post below will show you how use Z-Order Curves efficiently as a spatial index and that is something you probably don’t know yet.

Note: Now available on NPM as zbush

npm install zbush

The Z-Order Curve

The Z-Order Curve is one of many space-filling curves transforming multi-dimensional data into a single dimension while preserving locality. In the geospatial domain it allows us for example to transform longitude and latitude into a single number while preserving geographic proximity.

For spatial queries such as “find me the closest bike repair shop” we want to find points within a rectangular area. To search a rectangular area on the Z-Order Curve (highlighted in gray below) we start at the top left Z value of the rectangular area and walk the curve until we’re at the bottom right.

See full entry

At this point I’ve officially mapped out half of Bell Island, Newfoundland. Although I’m geographically halfway, the southern portion which I’ve mapped out is much less geospatially dense than the northern portion, so I’d estimate I’m about a third of the way through this project.

The ID Editor has been very intuitive so far in this process, and I have also learned a bit on how to use the JOSM editor for more specific geospatial processes. One thing I have yet to figure out is the display order of overlapping features, however I believe this is tweaked through the relations mechanic in the ID editor.

So far the minimal existing geospatial data that is present in this area has been accurate for the most part, with only slight alterations required to match the current satellite data that I’m basing my new features off of. That being said, quality varies, and it’s clear that some of these features were one-off additions by likely inexperienced users.

I think I’ll be able to keep up this mapping pace for the foreseeable future, so this project will hopefully get within the mopping up phase within a couple of months.

Location: Unincorporated Newfoundland, Newfoundland, Newfoundland and Labrador, Canada
Posted by CoreyN on 15 April 2025 in English.

Belfast Maine - Little City by the Water

Hello! I have just started getting into OpenStreetMap in the last few days, I absolutely love the way it works, and love to map out different towns. I lived in the town of Belfast, Maine for many years and visit this town so it holds a special part to me.

I’ve been adding all the “Downtown” houses that aren’t mapped, they are just Address points, and different new Houses, roads ETC. I just found out last night that I can actually MERGE address points with areas for houses so it’ll speed the process up a lot for me.

Location: Belfast, Waldo County, Maine, 04915, United States
Posted by JosephTJames on 15 April 2025 in English.

Khumalo 01

Overview

This is inspired by laambda19’s diary post on their mapping project, I want to document my work the same way with clear examples of before and after, adding more detail to the Bulawayo map. Aerial photography and local knowledge are the main driving force in mapping. There is scarce information available online, what little there is often requires a Facebook account.

Changes made

*I added colour to buildings and roofs

before & after

Nothing to see on Carto renderers but in simple3D renderers

Location: Khumalo, Bulawayo, Bulawayo Province, Zimbabwe
Posted by Jaiden1254 on 14 April 2025 in English.
Posted by Jaiden1254 on 13 April 2025 in English. Last updated on 14 April 2025.

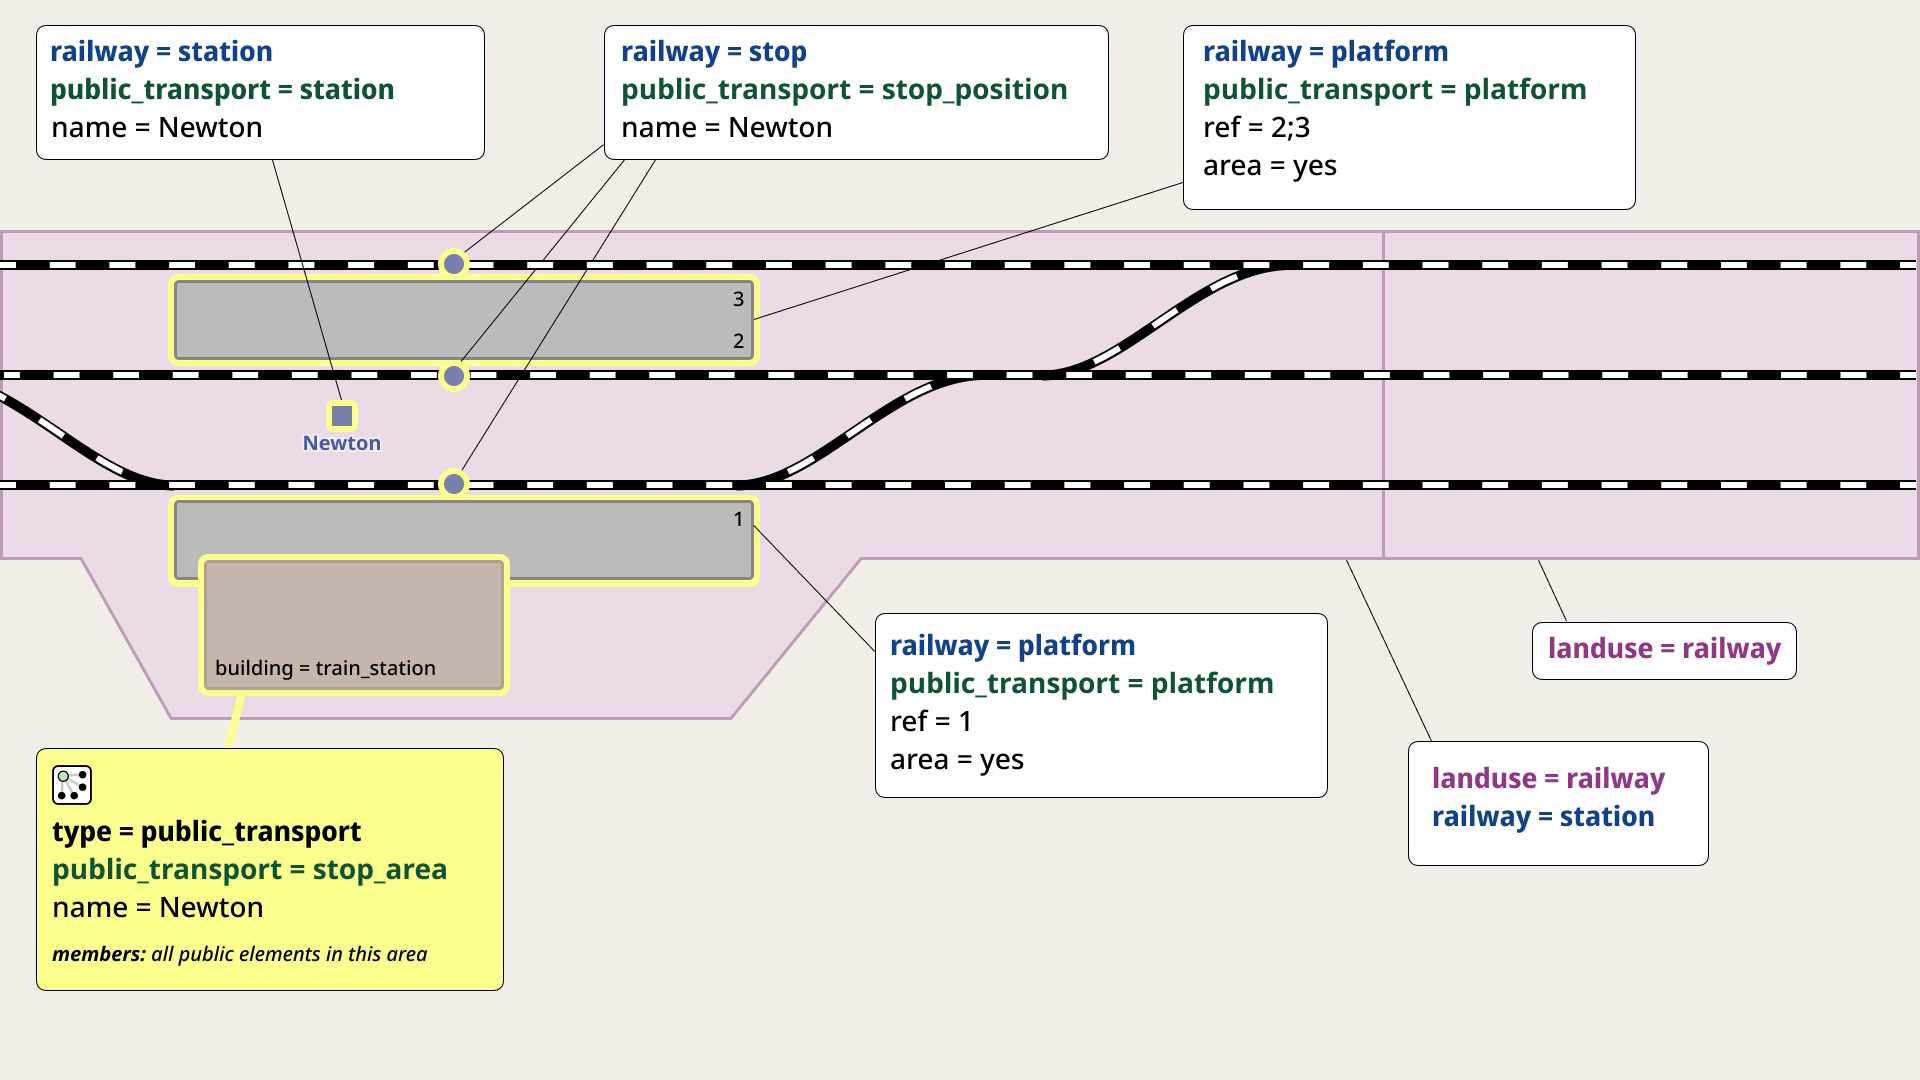
I’ve suggested an updated version of the diagrams explaining the tagging of railway stations. The goal is to make them simpler to understand, especially for newcomers, without losing the core meaning. There have already been some feedback and interesting ideas for further improvements.

More complete tagging diagram

I invite you to join the discussion — your input would be highly appreciated!

Posted by laambda19 on 12 April 2025 in English.

Yanzi (燕子镇) Mapping Project

Overview

This is the first entry in a series of Chineese towns I plan to map out.

Considering the lack of mapping detail in the vast majority of China, I plan to add detail to those places which lack even the basics, such as Yanzi. At first, only the location of the town was mapped as well as a VERY rough outline of the residential landuse.

If there are any mistakes, please tell me! I tried my best to overcome the language barrier

Changes Made

  1. Fixed the town name
  2. Added road network
  3. Added buildings
  4. Added nearby villages/hamlets
  5. Added bodies of water and the Yanzixi Reservouir
  6. Various amenities (W.I.P.)

To-Do List

  1. Continue adding amenities
  2. Add nature landuse

Before

Before

After

See full entry

Location: Miaoling, Gaoqiao Village, Yanzi Town, Hefeng County, Enshi, Hubei, 445800, China

Greetings OSM community,

The Humanitarian OpenStreetMap Team (HOT) adapted its governance structure last year to open seats on the Board of Directors for non-members. We are now recruiting two (2) Appointed Directors. Applications are open until April 24, 2025 — visit HOT Careers for more information and to apply.

The main reason for introducing Appointed (as opposed to solely Elected) Directors is to bring in people—and skill sets—that are not currently in abundance within our voting membership. Of course, a passion for geospatial technology and data in humanitarian, disaster, and climate response is still desirable. However, we are particularly seeking individuals with expertise in financial sustainability, diversified fundraising, and innovative hybrid business models. Ideal candidates will have a proven track record of leading impact-driven organizations through strategic growth and transformation.

As the current Secretary of the HOT Board of Directors, I’m happy to answer any questions about this opportunity. We’re excited to welcome new perspectives and strengths that complement our existing Board, which brings deep OSM/HOT history and expertise.

Best regards, =Russ

Use Russell.Deffner (at) hotosm (dot) org if you’d like to email inquiries related to this position.

On Tuesday we had a London pub meet-up. We are still doing this every couple of months. I stopped writing diary entries about them, but for some reason (for your enjoyment!) I’ve decided to write about this one. So here goes:

We were at the Jack Horner Pub. It’s becoming the default choice in this bit of London where previously I would’ve chosen the Blue Posts (Sam Smiths pub. I still quite like them but there are reasons not to). Meanwhile Fullers make it quite easy to book a table on their website(s), so in uncharacteristically organised fashion, I booked table! but characteristically I arrived quite late. I only booked for 8 people, and that turned out to be about right on this occasion. A small intimate gathering.

We had along Json Singh from india, who just moved to London. I like the way he’s named himself after a file format (I was forgetting to ask him about that). So we talked to him about the state of mapping in India. It sounds like it’s progressing well with lively communities in the cities, although sometimes struggling to build formal organisations, partly because it’s a little bit illegal there, so has to remain a bit underground. That’s mostly because of tensions around showing of borders. I wonder whether vector tiles will soon allow us to do the same slight-of-hand trick that other map providers do, showing different border positions depending on your IP address location. It’s kind of comical how well that trick seems to work to take the heat off. Another thing which is daft, is that there’s no official openly published data on the border position which officially must be shown on maps of india. That would be a basic way of helping assert a particular desired border position. But no.

See full entry

Location: Saint Giles, Bloomsbury, London Borough of Camden, London, Greater London, England, WC2H 8LG, United Kingdom
Posted by kumakyoo on 11 April 2025 in English. Last updated on 25 April 2025.

This blog post is part of a series of blog posts about the new OSM file format “OMA”. This is the sixth post. At the end of the article you’ll find links to the other blog entries.


The Oma file format uses a set of bounding boxes to sort the data geographically. The default set used by the converter consists of three grids.


The Default Grids

The first grid uses a mesh size of 1 degree in both directions between -45° and 45° latitude. Towards the poles the mesh size increases and finally the area around the poles is put into a single bounding box.

The grid looks like this:

the default bounding box grid, level 1

The second grid uses a mesh size of 10 degrees in both directions between -80° and 80° latitude. It does not include the areas around the poles.

This grid looks like this:

See full entry