This post is the result of a student project. The work was done by the following group of students: Alice Rey, Jihene Haj Hamouda, Yahia Heni, Mohammed El Mehdi Alaoui, Kaies Mhadhbi.
Try our online demonstration to find your own shade-optimized route! Discover how we improve pedestrian comfort during hot days by prioritizing shaded paths. (demo restricted to the Nantes Area)
Introduction
This project focuses on enhancing pedestrian routing in OpenStreetMap (OSM) by incorporating shade into route computations. Exposure to direct sunlight significantly affects pedestrian comfort, especially during hot weather, making shaded routes preferable even if slightly longer. Despite this importance, existing OSM data related to shade has typically been qualitative and limited in precision. To address this, we developed and implemented two complementary methods to integrate detailed shading information into OSM-based routing engines like Graphhopper:
-
An observational method involving onsite surveys and image analysis, to estimate and record the actual shade coverage on pedestrian pathways.
-
A computational method leveraging environmental data (building heights, tree locations) and sun positioning algorithms to automatically compute shade across entire road networks.
By combining these methods, our work provides more precise and actionable shade data, enabling routing algorithms to prioritize shaded paths, thereby improving pedestrian comfort and promoting walkability in urban environments.
Background
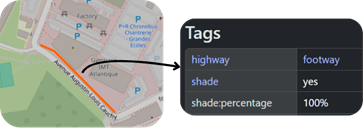
The wiki page for the shade key acknowledges the following binary values:
-
shade=yes: The feature is in shade.
-
shade=no: The feature is not in shade.
But if we look at taginfo, we find that there are many other values (although less common), and among these we used the value partial. While this qualitative tagging is useful, it does not capture the variability of shading along a feature or at different times of the day. This proposal builds on previous discussions (see Proposal:Shade) by introducing a more detailed, numeric approach, which we will talk about in more detail.
Two methods for determining shade percentage
1. Observation method
-
Onsite Estimation: Mappers perform on-site surveys to estimate the percentage of a road or path that is in shade.
-
Image Analysis: Satellite images and panoramax views are used to validate and refine these onsite estimates (or replace them if on-site surveys are too tedious).
-
Data Handling: The estimated percentage (ranging from 0 to 100) is recorded using the new shade:percentage key. In cases where only the qualitative shade key is available, routing applications (like Graphhopper) may use a conversion scheme:
-
shade=yes → 100
-
shade=no → 0
-
shade=partial → 50
-
-
Enhancements: There are many improvements that could improve upon this method. One enhancement we implemented is a script that automatically assigns 100% shade to ways located in parks, reflecting the generally higher tree cover.
Example: This is an example of what onsite estimation could look like. Here we tried to estimate how much each road was shaded and wrote it down, then we added these values to the OSM database.

2. Projection method
-
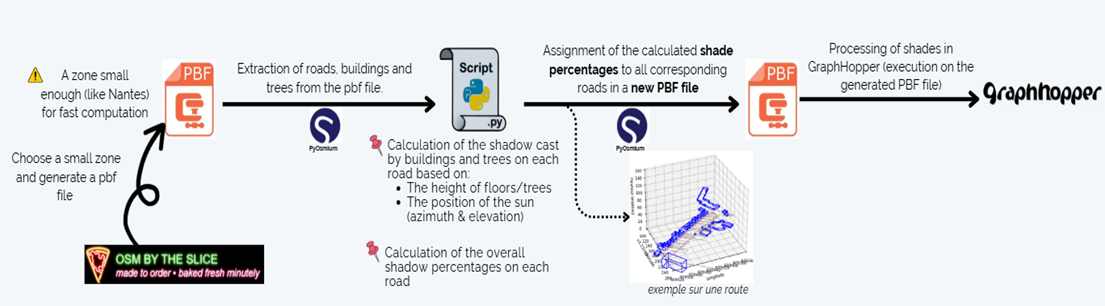
Workflow:
-
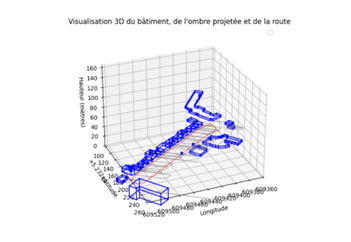
Automated Computation: A Python script processes OpenStreetMap PBF files by using building heights, tree data, and sun position to determine shade coverage. It uses osmium to parse OSM data in pbf files. This script takes a .pbf file and computes the proportion of roads located under shaded areas, estimating the shade percentage for each road based on buildings, trees, and geospatial data.
-
Integration: The computed percentage is stored in the shade:percentage key and is used in the same way as data obtained via the observation method.
Comparison of Methods
| Method | Advantages | Disadvantages |
|---|---|---|
| Observation Method | - Collaborative: the entire OSM community can contribute by recording shade percentages. | - Shade estimation is highly subjective (OSM guidelines recommend data be verifiable on-site). - Covering large areas requires significant contributor effort. |
| Projection Method (preferred) | - Comprehensive: shade coverage can be computed exhaustively for all roads. - More precise due to consideration of accurate sun position, buildings, and trees. - Easier to update regularly and scale to large areas. |
- Shade projection relies on various estimations (e.g., building heights), potentially introducing inaccuracies. |
We ultimately prefer the projection method due to its precision, scalability, and consistent reproducibility, despite its slight dependence on estimation accuracy for input data (e.g., building and tree heights).
Demonstration: Shade-Optimized Routing in Nantes
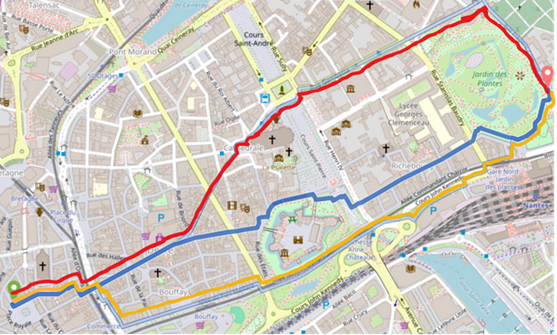
This screenshot illustrates the concrete result of our work. Our Graphhopper extension computes several possible routes between two points in Nantes. The blue paths represent routes optimized for shade, while the red route is the standard shortest path. Notice how the shade-optimized paths follow areas with greater tree coverage and avoid large sun-exposed arteries.
Try it yourself with our online demonstration! This link will take you directly to an example route computation in Nantes that shows the impact of our shade-optimized routing system. Compare the results with the standard profile to see the difference!
Implementation Details
-
Graphhopper Integration: The Graphhopper source code has been modified to parse both the shade:percentage and the traditional shade keys. A custom-made pedestrian profile prioritizes the numeric value when available. More details are available in this GitHub repo
-
Custom Profile: Graphhopper uses the following formula to evaluate the weight of each edge (way) in the graph:
Edge_weight = edge_distance / (distance * priority) + edge_distance * distance_influence
“Priority” is the variable we control in our profiles to determine how much shade will have an impact on the comutations. This is one of the custom pedestrian profiles we used:
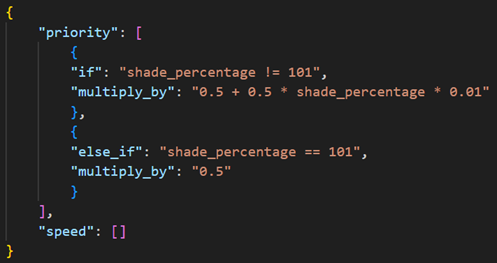
You can find our complete JSON profiles on GitHub
-
Graphhopper Modifications: Graphhopper has been updated to include parsers for shade:percentage and to adjust routing weights based on this new data.
-
Script Development: A Python-based workflow has been created to compute shade percentages from PBF files, using environmental data such as building heights and tree locations.
-
Fallback Mechanism: When shade:percentage is not present, the system falls back to converting the qualitative shade value using the aforementioned scheme.
Use Cases and Benefits
-
Enhanced Routing: Pedestrian routing algorithms can now favor paths with greater shade, reducing exposure to direct sunlight and enhancing comfort on hot days. This is the main reason we worked on this contribution.
-
Improved Data Quality: Recording shade as a percentage provides a more nuanced view of local environmental conditions, supporting both routing and quality assurance.
-
Urban Planning Applications: Detailed shading information can assist in identifying heat islands and in planning for improved walkability in urban environments.
Discussion and Future Improvements
-
Current Limitations:
-
The conversion from qualitative to numeric values (e.g., yes → 100, no → 0, partial → 50) is a provisional solution that may require refinement.
-
The formula for computing the weight of each way after taking into account the shade percentage needs a lot of testing and refinement.
-
-
Future Developments:
-
Explore more advanced algorithms to capture time-of-day and seasonal variations in shade.
-
Solicit community feedback to further refine both observation and projection methodologies.
-
Conclusion
The introduction of the shade:percentage key represents a significant advancement in the precision of mapping shade in OpenStreetMap. By providing a detailed, numeric assessment of shading conditions, this proposal aims mainly to enhance the experience of pedestrian routing, but can be used for other purposes. Community feedback and collaborative testing are encouraged to refine and adopt this proposal.
Discussion
Comment from Kylee Girl on 17 April 2025 at 21:30
Earth
Comment from monhiko on 19 April 2025 at 10:22
A innovate research! And the tag ‘shade’ I don`t use before, thanks for introduce it !
Comment from Lejun on 21 April 2025 at 05:31
Good job people! Another usecase (that I’m working on) FYI would be winter service, as shaded areas are more prone to icy patches during the day (aggravated by the lack of visibility to drivers).