OpenStreetMap logo OpenStreetMap

Diary Entries in English

Recent diary entries

Cross-posted from https://odeco-research.eu/?p=4999

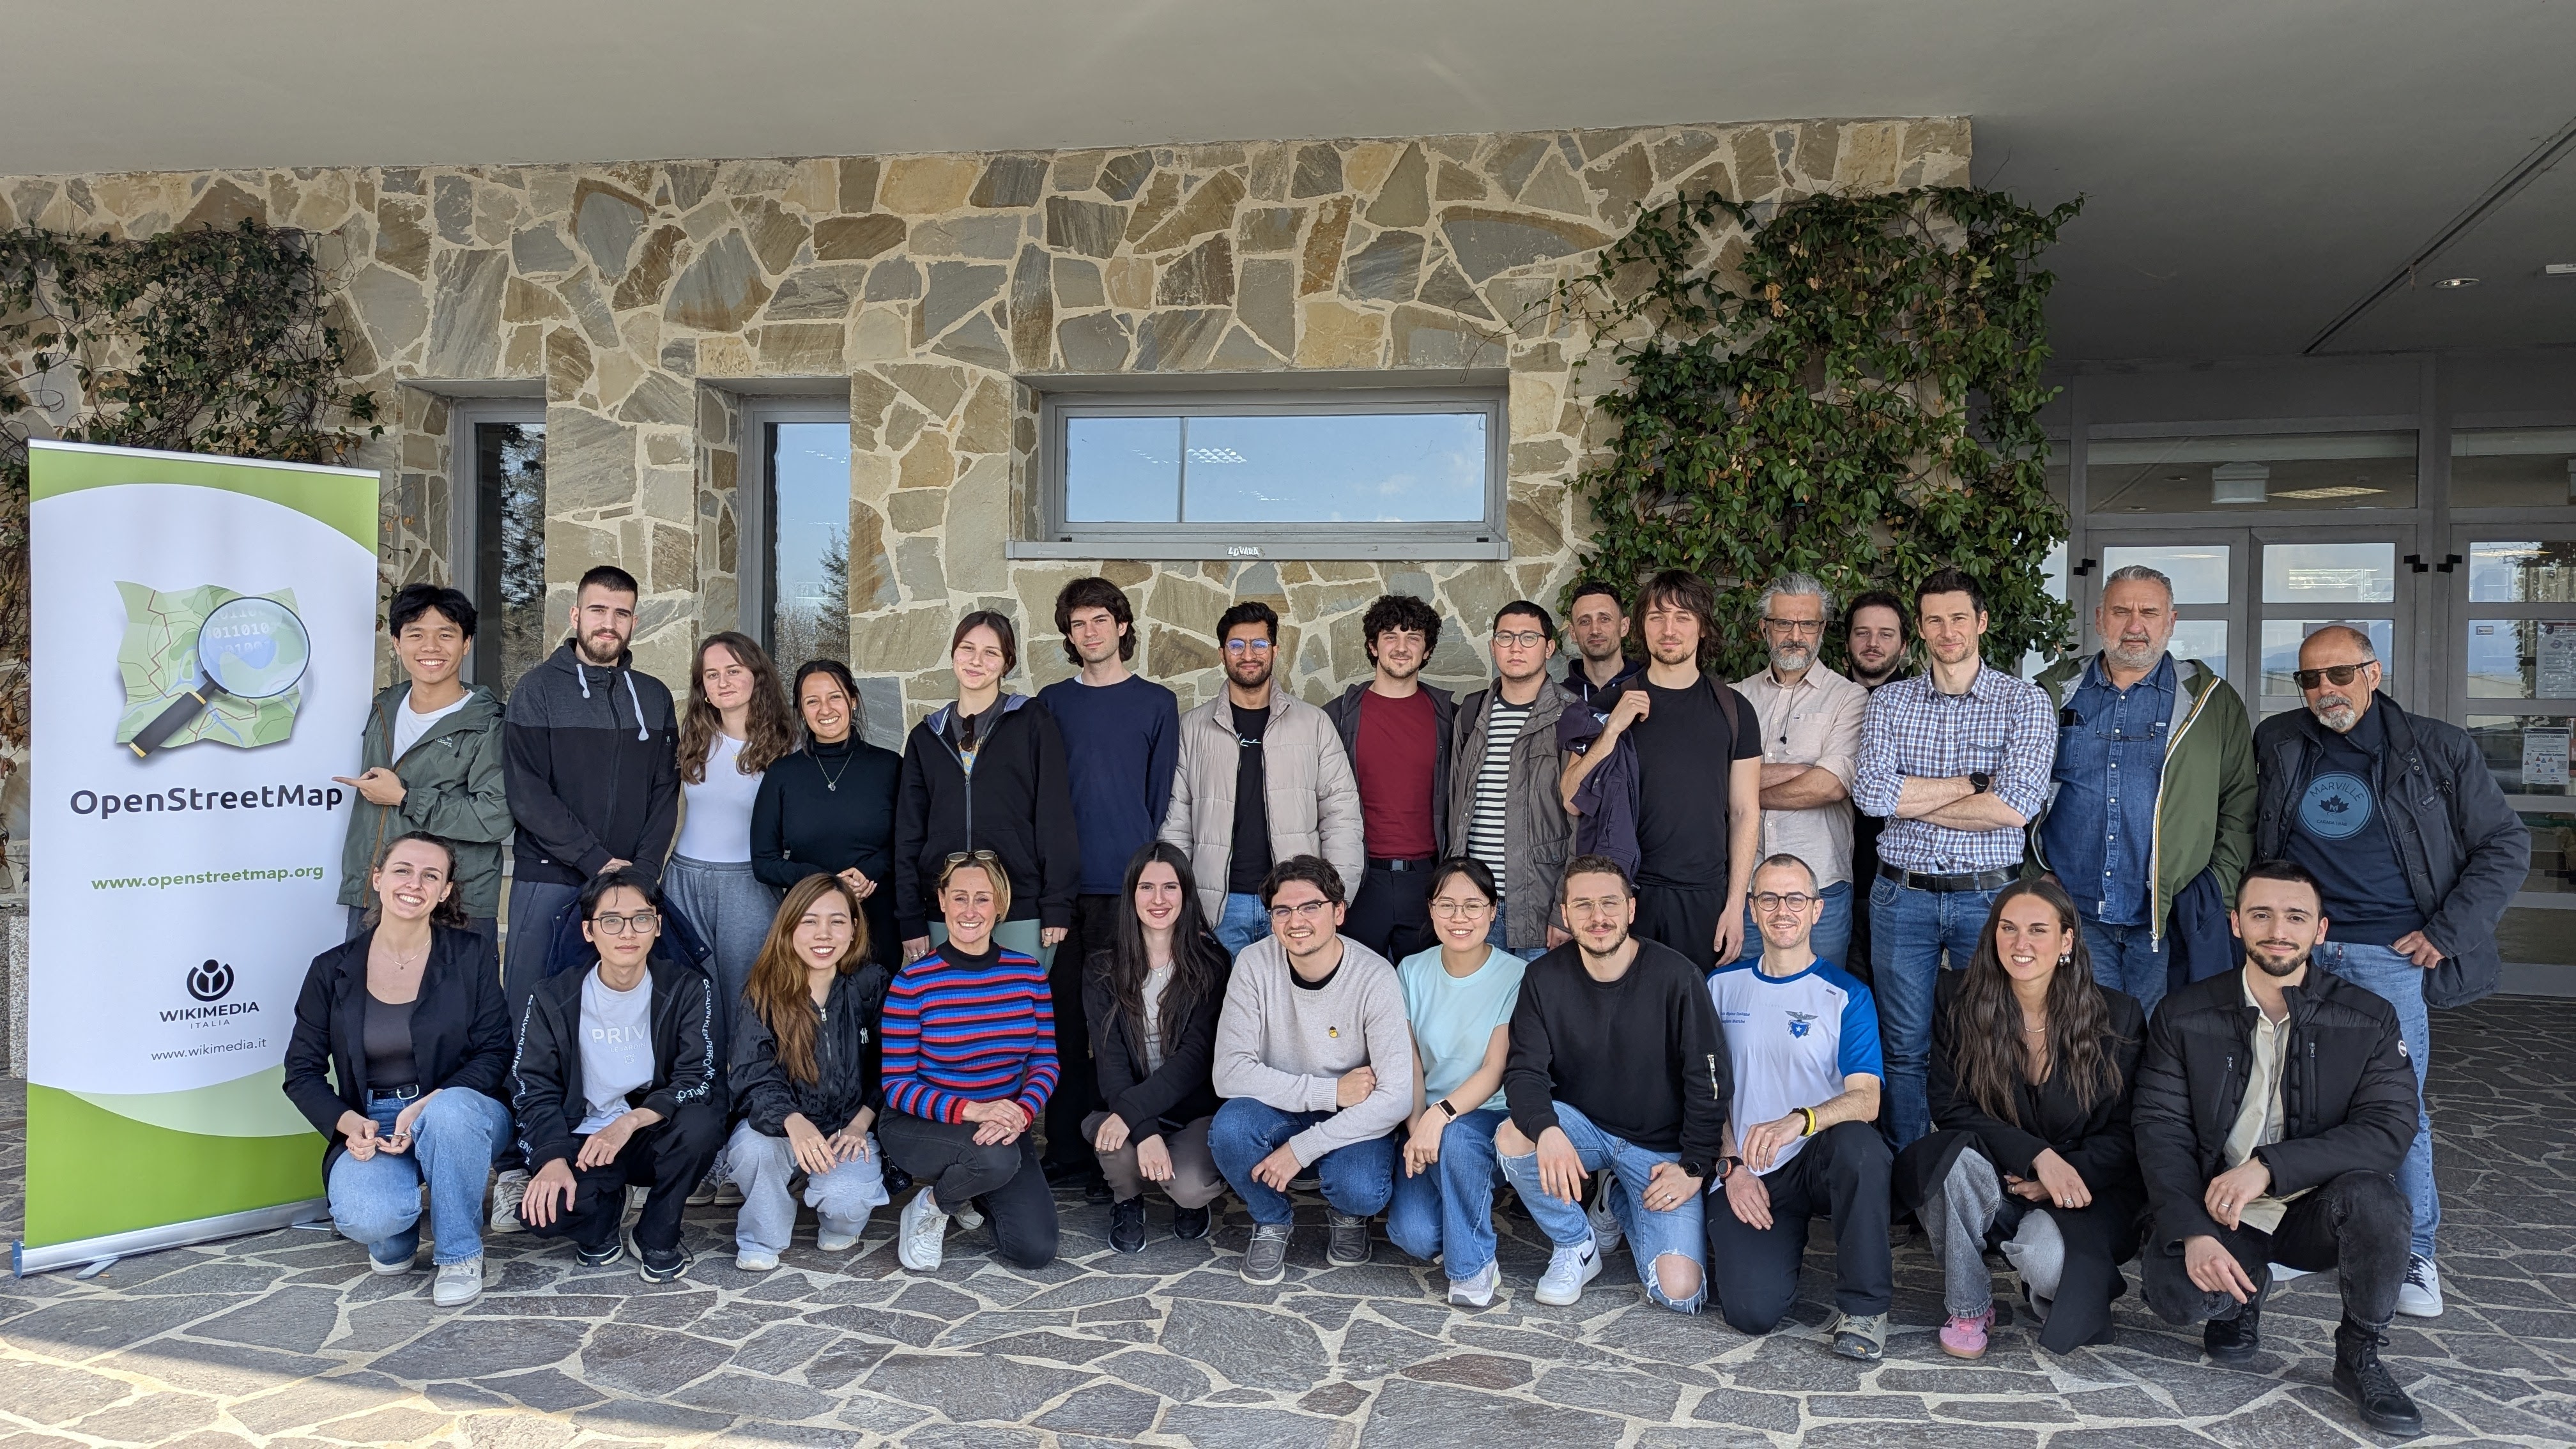
On Thursday, the 10th of April 2025, we celebrated the event “OpenStreetMap: Mapping & Hiking” at the University of Camerino, Italy. After two months of preparation, the event was well-received and had a diverse and satisfied crowd.

Group photo

OpenStreetMap (OSM) is a collaborative geographical database of the world. Millions of people use its data, and also millions contribute to it in various ways. However, there are still places where there is no strong local community, where its villages and rural areas are heavily undermapped. Camerino, while the town itself is well mapped, has some incredible nature and cultural spots nearby, which needed an update. As well, being a university town with students coming from all corners of Italy and the world, makes it a prime location for engaging in outreach activities and kickstarting a community.

See full entry

Location: San Paolo, Camerino, Macerata, 62032, Italy

How complete are addresses in OpenStreetMap in Belgium? After several status these previous years (see September 2022, in May 2023, and in May 2024, November 24), I finally adapt the process to analyse addresses completeness for all Belgium!

The aim of this small article is to assess the completeness of addresses in Belgium for OSM, compared to official data. Basically we count the address points in OSM and in official data by municipalities. We don’t check the address quality here, we know there can be errors in OSM data, and even in official data.

How I proceeded

Using QGIS, I gathered OSM addresses and official ones. OSM data is imported in a PostgreSQL database using osm2pgsql based on a pbf file for Belgium from the 24th of April. Official data is coming from BEST address csv files, that gathers Belgian addresses for the 3 regions of the country.

Addresses in OSM can be mapped on buildings (most of the cases), hence on a way, or on a node. I consider only objects with the “addr:housenumber” tag. First, I made a single layer of addresses points from OSM data by merging the centroids of buildings with this tag and the points with these tags, by excluding the places where these two layers overlaps (typically points with an address inside a building where there is already an address). The method is far from perfect: I don’t consider relations, I miss some way objects with addresses but without the building tag (typically some schools), and probably a lot of other edge cases due to the “joyeux bordel” of the OSM data model.

Official data considers several address points for each building unit, or box number. It means that there are often several points at the same place, especially in cities, accounting for each box number. Since the mapping of box number is often not so used in OSM, I merged all points at the same place (given a buffer of 1 meter) as a first step. This reduces the number of official address from 7,004,321 to 4,454,017.

See full entry

Location: Quartier Saint-Jacques - Sint-Jacobswijk, Quartier du Centre - Centrumwijk, Pentagon, Brussels, Brussels-Capital, 1000, Belgium

EN version below

Ce post a été initialement publié ici.

Le 14 décembre 2024, Mayotte était frappée par le cyclone Chido, le plus violent qu’elle ait connu depuis plus de 50 ans. Rapidement, l’IGN a diffusé des imageries Pléiades prises les 17, 18, 20, 21 et 24 décembre et a confirmé le 25 décembre que la communauté OSM pouvaient les utiliser comme source dans ses éditions. De suite, j’ai eu l’envie de les utiliser pour évaluer les dommages du bâti. Pourquoi le bâti ? Du point de vue cartographique, parce que les dommages sont plus visibles sur des infrastructures polygonales que ponctuelles ou linéaires. Du point de vue de la réponse de crise, parce que les dégâts étaient particulièrement importants, ayant fait disparaître ou rendu impraticables les foyers de beaucoup d’habitants.

Trois mois après, ce billet revient sur les grandes étapes de cette cartographie toujours en cours, organisée bénévolement sur du temps libre.

Revue et choix méthodologique

La cartographie des dommages du bâti à l’aide d’imagerie post-désastre n’a évidemment pas été inventée dans OpenStreetMap et des expériences similaires ont déjà été menées par le passé dans OSM.

Après le passage du cyclone Haiyan sur les Philippines en novembre 2013, une cartographie des dommages du bâti avait été réalisée sur la région autour de Tacloban. Par ailleurs, des chercheurs du Harvard Humanitarian Initiative (HHI) avaient publié en mars 2016 un article détaillant une méthodologie qui avait été de suite adaptée à OSM sous la forme de modèles de préréglages et d’un style cartographique pour JOSM, et appliqués notamment à Haïti après le passage du cyclone Mathieu en octobre 2016.

See full entry

Location: Combani, Tsingoni, Mayotte, 97680, France

OpenStreetMap Indonesia, in partnership with TomTom, organised a Community Mapping Party at GoWork Plaza Indonesia in Jakarta on Saturday, 26 April 2025.


Planning

January 23, 2025 – 17:05 WIB

“For those living in the Jabotabek area, how about we hold our first offline monthly talk next time and align it with the TomTom Mapping Party event?”

Initial discussions about hosting an offline gathering began among members in the Greater Jakarta area. A suggestion was made to align the monthly community meeting (usually held online, but in this proposal, it will be held offline for the first time) with an upcoming Mapping Party event organized by TomTom. The idea was presented in an open-ended way, inviting members to consider the possibility when time allowed.

January 30, 2025 – 08:34 WIB

“It might be better to hold it before Ramadan.”

The conversation picked up pace, with another participant suggesting that it would be preferable to hold the event before the fasting month (Ramadan) began. The comment hinted at the logistical advantages of scheduling it earlier.

February 3, 2025 – 11:01 WIB

“If it is held before Ramadan, preparation time would be very tight. It has been proposed to schedule it after Eid, possibly in mid or late April, and a response is still awaited.”

It was mentioned that holding the event before Ramadan might be too rushed given the short preparation time. As a result, a new proposal was introduced: to hold the Mapping Party after the Eid al-Fitr holiday, possibly in mid to late April. Final confirmation was still pending at that point.

March 23, 2025 – 14:28 WIB

“If we hold an offline mapping party and meetup at the end of April 2025 somewhere around Jabodetabek, would participants be able to attend?”

See full entry

Posted by Ed48152 on 26 April 2025 in English.

I have added a pin for my house, which is at 38150 N Vista Dr in Livonia! From here, I have encountered tons of wildlife, including fish, and generally been treated pretty well. There are parks nearby, riparian zones, old-growth forests, modern civilization including a hotel with swimming pool, and plenty of transportation opportunities. You can even walk here. There’s water, a lawn, and interesting people here. My basement is the coolest!

Location: The Villas Condos, Livonia, Wayne County, Michigan, United States
Posted by Jaiden1254 on 26 April 2025 in English.

This blog post is part of a series of blog posts about the new OSM file format “OMA”. This is the last post. At the end of the article you’ll find links to the other blog entries.


I will end this series of blog posts about the OMA file format with a short summary of all the feedback I have received and a brief outlook. But first I’d like to give you a real-life example that uses OMA files.


A Real-Life Example

Over a year ago I wrote a renderer suitable for displaying micromapped areas. I used it to generate tiles at zoom level 20 for the restricted area of my micromapping project.

Now I have adapted this program to use OMA files and recomputed the tiles for the area of my micromapping project. The program can be found on GitHub; and there’s a slippy map showing the tiles.

For example, this is what the station forecourt of Hilden looks like:

station forecourt of Hilden


Summary

See full entry

Hello, I have completed work for the first part of the project. Central Wilson and the length of Fish Creek road have reached a point where roads, driveways, structures, and water features have been thoroughly digitized. Check it out and let me know what you think! :) I am sure there are some things I’ve overlooked and maybe some mistakes in these areas. However, given that they are seeing a fair amount of development, I will likely be returning to them soon to update and double check for possible mistakes. I do have a question for you all out there, more experienced than me. I have come to despise the existing residential-landuse areas in Wilson. They are a mess and seem to be quite outdated. I would be more than willing to fix or make new ones, but I don’t know if there is a specific way to go about that kind of thing. Do they need to be based on any administrative boundaries or are they a more arbitrary area? As for what’s next in the project, I am moving east to the Stilson area to fill in completely missing neighborhoods, improve roads, add water features, etc. I will give the next update once completed.

Location: Teton County, Wyoming, United States

The relationship between municipalities and populated places in the United States is often not obvious, especially in New England due to the naming of their local governments. Naming them towns has blurred the distinction of populated places and municipal governments, when in reality, a clear distinction can be made between the two.

First, let’s look at the things almost everyone should agree with. Nodes tagged with a “place” tag can be referred to as “populated places”, or named concentrations of people. The GNIS definition of a populated place says it best: “Place or area with clustered or scattered buildings and a permanent human population (city, settlement, town, village). A populated place is usually not incorporated and by definition has no legal boundaries. However, a populated place may [correspond with a] “civil” [entity], the legal boundaries of which may or may not coincide with the perceived populated place. Distinct from Census [places] and Civil [entities].” In other words, nodes with a place tag refer to a human settlement, NOT to a municipality. They are the places one might see on a green direction sign while on the road. The exception to this is if the municipal boundary corresponds to the extent of the populated place, which is the norm in most states.

However, in New England, town boundaries are usually formed out of straight lines and rivers, not with the intention of delineating the boundary of a populated place. Therefore, even if a town shares a name with a populated place within its borders, the populated place will not always fill the entire municipality, leaving room for other populated places to fill the rural areas. Some municipalities even lack a populated place with the same name as it. This leads to there being no 1:1 correspondence between municipalities and populated places in New England.

See full entry

I’ve fixed some accidental error introduced in changeset 165092634 by user “Hooptie Bike Lounge”.

Both errors are now fixed in changeset 165210184.

Error #1 : Bowen St

They accidentally moved a node of Bowen St by 100’s of feet.

  • Before their edit the Bowen St node was here

  • their edit accidentally moved the node 100’s of feet to here.

Error #2 : Sidewalk on Boston Ave

They accidentally moved a node 100’s of feet for the sidewalk along the south side of Boston St near Hooptie Lounge.

  • Before their edit the Boston Ave sidewalk node was here

  • their edit accidentally moved the node 100’s of feet to here

Location: Longmont, Boulder County, Colorado, United States

Hey fellow mappers! 👋🌍

I’m beyond excited to share that the global State of the Map (SOTM) 2025 will be held in Manila, Philippines 🇵🇭 — and preparations are already in motion! For those who are also planning ahead, here are some important links you should definitely bookmark::


🔗 Link Type URL
🌍 Official Website https://2025.stateofthemap.org/
📝 Call for Participation (CfP) https://2025.stateofthemap.org/calls/general/
🧪 OSM Science Track – Call for Abstracts https://2025.stateofthemap.org/calls/osm-science/
💸 Call for Travel Grant https://2025.stateofthemap.org/calls/travel_grants/


🌐 Official SOTM Social Media & Platforms

🌐 Platform Link
🐘 Mastodon https://en.osm.town/@sotm
📺 YouTube https://youtube.com/stateofthemap
📘 Facebook https://facebook.com/stateofthemap
📸 Instagram https://instagram.com/stateofthemap
💼 LinkedIn https://www.linkedin.com/company/stateofthemap/
💬 Telegram Group https://t.me/sotm_international
📝 OSM Wiki Page https://wiki.openstreetmap.org/wiki/State_of_the_Map_2025
📣 Official Blog https://blog.openstreetmap.org
💻 GitHub https://github.com/openstreetmap/stateofthemap-2025
❤️ Support OSM https://support.openstreetmap.org

If you’re thinking of applying, speaking, or volunteering — go for it! The energy, the people, and the purpose behind SOTM are truly unmatched.

Let’s map the future, together. See you in Manila! 🇵🇭


Brazil Singh,
On behalf of the SOTM organizing committee.

It’s difficult to write in all map style languages. A style written in JSON, like MapLibre, has a few extra pain points because JSON is not designed for editing by humans.

Some “common” style languages are

  • CartoCSS
  • Mapnik XML
  • MapCSS
  • MapServer
  • MapLibre GL/Mapbox GL

Some, like CartoCSS, are designed for human editing, while others, like Mapnik XML, serve as a lower-level language. MapLibre GL falls into this category of not being designed for editing by humans. MapLibre GL preprocessors like glug were designed to help with this, but none of them have taken off. Other style projects like openstreetmap-americana have taken a different route. Their developers have written a program in JavaScript that generates the style.

I’m taking a different route. I’m creating a language that uses minimal pre-processing of its input to produce MapLibre GL. I don’t aim to solve every difficulty with MapLibre GL, only the ones that impact me the most. The end result will be a pre-processing language

The biggest problems I encounter when writing MapLibre GL are

  1. No comments

    Comments are essential so other readers understand what’s written

  2. Everything has to be in one file.

    With large styles this is a burden. More than one file makes it easier to edit.

  3. Having to repeat definitions instead of using a variable.

    Something like a color or symbol definition might appear a dozen times in the style. If you want to change it, you need to make sure you got all the occurrences.

  4. Inability to make versions of the style in different colors.

    When you only want to change a few superficial elements of the style, you want to contain those changes to one file.

  5. Not having support for more colorspaces

    I work in perceptual colorspaces like Lch. It’s a lot of converting that the computer should automate.

What issues have you found when writing MapLibre GL styles?

This blog post explains how I handle a typical bug report for the new OSMF Shortbread tiles. Here, I focus on the “island” seems to be missing from “place_labels” report from SomeoneElse

After verifying that the report is correct, I set up my editor environment. It’s useful to have an environment that syntax highlights Jinja SQL files, as well as other files. I use a Visual Studio Code-based editor with the Better Jinja plugin.

The issue is in the place_labels layer. After checking Shortbread, I see that place=island should show at zoom 10 or higher, so there is a bug. Tilekiln creates tiles by reading definitions from shortbread.yaml, so I check there for the place_labels definition.

place_labels:
    description: Holds label points for populated places.
    fields:
        kind: Value of OSM place tag
        name: *name
        name_en: *name_en
        name_de: *name_de
        population: Value of OSM population tag
    sql:
    - minzoom: 4
        maxzoom: 14
        file: shortbread_original/place_labels.04-14.sql.jinja2

This file shows that for zooms 4 to 14, the SQL for the layer is in shortbread_original/place_labels.04-14.sql.jinja2. Since this file is in shortbread_original, osm2pgsql-themepark created it, and it remains unchanged.

SELECT
        ST_AsMVTGeom(geom, {{unbuffered_bbox}}, {{extent}}, {{buffer}}) AS way,
        name,
        name_de,
        name_en,
        kind,
        population
    FROM place_labels
    WHERE geom && {{bbox}}
        AND {{zoom}} >= minzoom
    ORDER BY population desc

There aren’t any obvious bugs in the SQL. There’s no filtering out of islands, so either the data isn’t making it into the place_labels table or it has the wrong zoom. The data is loaded by osm2pgsql, and shortbread.lua tells osm2pgsql how to do that.

themepark:add_topic('shortbread/places')

See full entry