
The 20% drop in new contributors (preliminary analysis)
Posted by SimonPoole on 8 January 2023 in English. Last updated on 2 May 2024.I haven’t done a contributor statistics diary post in a long time, but I suspect that the latest update of the graphs on the wiki is likely to lead to some questions.
As we can see in
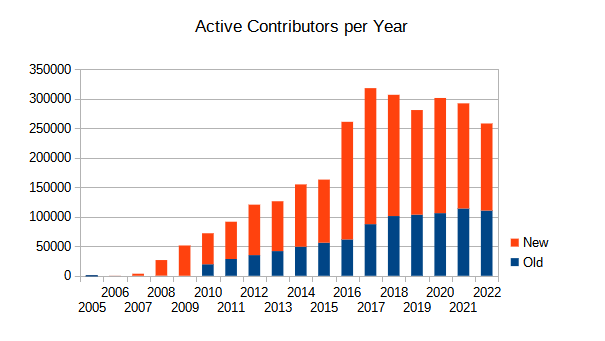
the number of new contributors to OSM has dropped quite a bit in 2022. As the overall number of contributors has always been dominated by the new contributors it isn’t a surprise that the overall number is down too.
The interesting question is if we can pinpoint any “source” of this reduction. As a 1st investigative step I gave the numbers for editing apps used by new editors a look. I’ve been producing the numbers for a long time, but have never published them previously, if we look at 2021 and 2022 we see:
| 2021 | 2022 | |
|---|---|---|
| iD | 152’572 | 119’982 |
| Maps.me + OM | 9’563 | 10’930 |
| Streetcomplete | 7’591 | 6’493 |
| JOSM | 3’128 | 3’039 |
| OsmAnd | 1’642 | 1’711 |
| Other | 3’765 | 5’492 |
| Total | 178’261 | 147’647 |
As we can see the majority of the drop is caused by a lower number of new contributors via iD, all other sources are more or less stable. This rules out causes like we have previously seen with Maps.me that are primarily due to actions by the apps marketeers.
Naturally the reduction is not a “fault” of iD, it just means less people are arriving at openstreetmap.org and making their first edit there. If there is a notable difference in sources for new mappers would need analysis on the OSMF side of things as this requires access to the website statistics. It is however likely that the effect is not going to be noticeable in the sign up numbers as these outnumber actual new contributors by far.
What we can do with just OSM data is see if there are regional effects or changes with respect to other “well known” sources that might throw some light on the matter. Currently I need to re-geocode my changeset database which will take a bit, but what I’ve always produced are numbers on HOT originating new mappers.
In 2021 there were 57’284 new mappers that had HOT related hashtags in their 1st changeset, in 2022 “only” 32’346, a drop of nearly 25’000 that would explain a lot. However this needs to viewed critically as changes in how HOT acquires new mappers and initial mapping introducing could just as well lead to this difference. It should be noted that 2020 and 2021 were “peak HOT” and that the 30k is more in line with the long term average.
I intend to update this post if there are any new insights that are relevant.
See the end of maps.me for more on how strongly the stats were effected by the decisions of a single app owner without an underlying trend pro or con OSM.
Discussion
Comment from pnorman on 8 January 2023 at 21:19
In 2022 we had 813883 account creation events in Matomo, while in 2021 there were 953865. This is fairly close to the percentage drop in edits.
Unfortunately for finding out more, about 70% of people creating accounts come to the site from direct entry or search engines, which don’t tell us how they arrived at OSM. There’s 20% coming from website links, and the other 10% is social media and rounding errors.
The website category can be further broken down. For reference, there was a drop of 15% overall. The following are the top inbound sites for account signups in 2021, with the number of signups in each year, and the percentage difference.
Not all signups are equal, of course. I suspect a signup driven from a local chapter website is more likely to be useful than one coming from a SEO site.
Comment from SimonPoole on 9 January 2023 at 06:43
@pnorman thanks for the numbers, I think they at least indicate that there was something going on with the HOT numbers.
Naturally contributions tend to lag conversion/signup by a fair bit, but on the other hand if we assume that most HOT signups happen immediately at events at which the signups start mapping, those numbers would actually align with the periods we are looking at.
Comment from DeBigC on 9 January 2023 at 07:49
I wouldn’t deign to say this applies everywhere but the thought some of us in Ireland have had is that we have passed some critical mass point in the developed countries for people who are going to make accounts and start editing.
We have a welcome tool set up detecting our new mappers for around a year now, and I think 2022 saw 432 new signups on our island, which is basically one per day and two at weekends. This sounds great but a big amount of these are “one-node adders”, usually their own business. Others would be just checking it out and realising they couldn’t sustain interest once they add a few features. Some of the other chapters and countries are set up on this and it might be useful to draw comparisons. Nigeria for example had 500 signups in two months, and nothing for the rest of the year - which goes to show that promotional or event driven effort makes this rise and fall.
Comment from SimonPoole on 9 January 2023 at 10:24
@DeBigC sounds kind of normal and roughly in line with the influx of new mappers we see here https://www.openstreetmap.org/user/SimonPoole/diary/397810
One time editors have always been common as long as I’ve been involved in OSM and “larger mappers” that is contributors that have turned mapping in to their hobby are rare and I wouldn’t really expect that to change.
The dynamics are naturally going to be different in developing countries.
Comment from PierZen on 10 January 2023 at 17:08
thanks Simon and Norman for these insights.
Heigit provides Tasking Manager Session statistics for missingmaps at https://humstats.heigit.org/statistics.html?org=missing_maps
Statistic files can be downloaded and the graph titled Total Mapped Sessions by Usergroup presents a profile of Task manager sessions by user’s experience. Looking at this graph, we observe a drop of sessions from 2019. More contribution in 2021 is followed by a sharp drop in 2022. And this drop is not only from the less experienced.
Session statistices is not the best indicator but confirms the drop of contribution in the last few years. It would be interesting to see such profile by No. of contributors and Objects edited.
Comment from PierZen on 10 January 2023 at 18:38
Revisiting Heigit stats, I realise that MissingMaps do not include all tasking manager sessions. We have a different perspective selecting All projects with an increase in 2021-2022 over 2020. Analysis of CSV files should show profile by organisations using the tasking manager.
Comment from RicoElectrico on 12 January 2023 at 14:50
Please be aware that uBlock Origin blocks Matomo due to its inclusion in EasyPrivacy list.
Comment from JJIglesias on 25 June 2023 at 15:48
I may be wrong, but the problem is not the lowering in the numbers of new mappers, but the retention rate of existing mappers. #youthmappers produce “peaks” of “new contributors” for short periods, but they flew away, basically becuase they are doing some “homework” at their Universities, but do not get hooked by the OSM idea. This needs to be considered as well.
Comment from SimonPoole on 25 June 2023 at 15:57
@JJIglesias the retention rate has always been low to very low (with some small differences), and youthmappers are no different than other similar sources. The relevant number of concern (new mapper influx) isn’t affected by this in any case, any effect on “large mapper” growth will be longer term, if there is any at all.